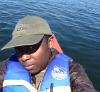
End hunger, achieve food security and improved nutrition and promote sustainable agriculture
It is time to rethink how we grow, share and consume our food.
If done right, agriculture, forestry and fisheries can provide nutritious food for all and generate decent incomes, while supporting people-centred rural development and protecting the environment.
Right now, our soils, freshwater, oceans, forests and biodiversity are being rapidly degraded. Climate change is putting even more pressure on the resources we depend on, increasing risks associated with disasters such as droughts and floods. Many rural women and men can no longer make ends meet on their land, forcing them to migrate to cities in search of opportunities.
A profound change of the global food and agriculture system is needed if we are to nourish today’s 815 million hungry and the additional 2 billion people expected by 2050.
The food and agriculture sector offers key solutions for development, and is central for hunger and poverty eradication.
Facts and Figures
Hunger
Globally, one in nine people in the world today (815 million) are undernourished
The majority of the world’s hungry people live in developing countries, where 12.9 per cent of the population is undernourished.
Asia is the continent with the hungriest people – two thirds of the total. The percentage in southern Asia has fallen in recent years but in western Asia it has increased slightly.
Southern Asia faces the greatest hunger burden, with about 281 million undernourished people. In sub-Saharan Africa, projections for the 2014-2016 period indicate a rate of undernourishment of almost 23 per cent.
Poor nutrition causes nearly half (45 per cent) of deaths in children under five – 3.1 million children each year.
One in four of the world’s children suffer stunted growth. In developing countries, the proportion can rise to one in three.
66 million primary school-age children attend classes hungry across the developing world, with 23 million in Africa alone.
Food security
Agriculture is the single largest employer in the world, providing livelihoods for 40 per cent of today’s global population. It is the largest source of income and jobs for poor rural households.
500 million small farms worldwide, most still rainfed, provide up to 80 per cent of food consumed in a large part of the developing world. Investing in smallholder women and men is an important way to increase food security and nutrition for the poorest, as well as food production for local and global markets.
Since the 1900s, some 75 per cent of crop diversity has been lost from farmers’ fields. Better use of agricultural biodiversity can contribute to more nutritious diets, enhanced livelihoods for farming communities and more resilient and sustainable farming systems.
If women farmers had the same access to resources as men, the number of hungry in the world could be reduced by up to 150 million.
4 billion people have no access to electricity worldwide – most of whom live in rural areas of the developing world. Energy poverty in many regions is a fundamental barrier to reducing hunger and ensuring that the world can produce enough food to meet future demand.
Space-based Technologies for SDG 2
Soil conditions, water availability, weather extremes and climate changes can affect agriculture and food security. Space technologies provide weather data for agricultural planning, helping to boost productivity and mitigate the effects of food shortages.
UNOOSA’s capacity building activities help member states use space technology for more productive agriculture. Read more here.
Dr. Pietro Campana studied environmental engineering with a focus on fluid dynamics, hydrology, and water resource management, before undertaking a PhD on solar irrigation systems. He is working on the water-food-energy nexus and is currently evaluating the first agrivoltaic system (a photovoltaic system that allows the combination of both electricity production and crop production on the same land to increase the land use efficiency) in Sweden. He constantly strives to work on something that can make a difference to people’s lives and finds developing tools and services that can solve water issues very exciting. He believes that to address the nexus challenges, we need novel technologies and more research and development funding.
Sawaid Abbas, Assistant Professor at the Centre for Geographical Information System, University of the Punjab, Lahore, Pakistan discussed his extensive work in addressing water-related challenges through the nexus between smart sensing and space technologies. His thematic focus spans water scarcity, food security, climate risks, and environmental monitoring with an emphasis on the Asia-Pacific region, including Pakistan and China. Key Sustainable Development Goals (SDGs) guiding his work include SDG2 (Zero Hunger), SDG13 (Climate Action), SDG15 (Life on Land), and SDG11 (Sustainable Cities and Communities).
Abbas's passion for water emerged during his early career at the World Wide Fund for Nature (WWF), where he was involved in Pakistan’s Wetland Program and witnessed the impact of water on associated ecosystems. This sparked his interest in understanding and managing water, forestry, and wildlife resources. He recently studied coastal ecosystems and their responses to climate and anthropogenic stressors in the Asia-Pacific region. The Living Indus – Investing in Ecological Restoration has become a new focus of interest for him, addressing sustainability challenges related to food security, river basin management, and efficient water use in alignment with the UN Decade of Ocean objectives.
Abbas shared his fascination with water, recognizing its complex and essential nature. He is captivated by its beauty in all forms and acknowledges its fundamental importance for life on Earth. This water connection further motivates his commitment to addressing global water challenges and promoting sustainable water use through innovative solutions.
Sawaid Abbas's work, stimulated by both professional commitment and personal fascination, stresses the critical role of space technologies, particularly earth observation, smart sensing nexus, and artificial intelligence in addressing water-related challenges. His research contributes to the development of innovative solutions for sustainable water use, environmental protection, and disaster response, aligning with global goals for a more resilient and water-secure future.
In 2019, floods caused 43.5% of all deaths due to natural disasters and thereby represent the deadliest type of disaster with an increasing number of events compared to previous years (CRED, 2019). Floods furthermore lead to the highest number of people affected compared to other disasters as they affect human activities and the economy (CRED, 2019; Elagib et al. 2019).
The exacerbation of climate change-induced droughts, among other weather extremes, is escalating into a critical global challenge particularly in arid regions like the Southwestern U.S. where droughts pose grievous environmental and socio-economic threats. Increasingly frequent, intense, and enduring droughts are commonplace generally in Western U.S. inflicting damages on crops and aggravating record-breaking wildfires year after year. Drought is the second-most expensive natural disaster in the U.S. behind hurricanes, costing an average of $9.6 billion in damages per event.
Therefore, continuous innovation and deployment of cost-effective and time-efficient water resources monitoring tools could help mitigate severe environmental and socio-economic impacts of droughts which currently impact livestock and wildlife management in Southwest U.S. A recent innovation as a potential climate change adaptation solution is the Surface Water Identification and Forecasting Tool (SWIFT). The Google Earth Engine-based tool is a remote sensing-based technology that leverages optical imagery derived from Landsat 8 OLI and Sentinel-2 Multispectral Instrument (MSI), and radar imagery from Sentinel-1 C-Band Synthetic Aperture Radar (C-SAR) to monitor near real-time the availability of water in stock ponds and tanks. As drought conditions are expected to worsen with rising global temperatures, SWIFT is designed to provide a valuable and affordable stock water monitoring solution for cattle producers and land managers, etc.
Irrigation illustrates a major dilemma of agriculture: On the one hand, a growing world population demands more food and biomass (for example for energy production). On the other hand, natural resources such as water are only available in limited quantities and excessive use often leads to the degradation of ecosystems, which in turn has adverse effects on agricultural production and local livelihoods.
When you think about agriculture, you probably imagine a few basic things in your mind. Huge stretches of flat land, massive harvesting machines, the heat on your skin from sunlight and, perhaps most importantly, soil. This image in your mind is a common one. Humans have been tilling, seeding, and farming land since the dawn of civilization, and modern industrial farm techniques tend to dominate our conception of agriculture.
In Pakistan’s southern province, Sindh, lies the world’s only fertile desert in the world. The Tharparkar Desert stretches till the southeastern parts of Punjab, joining the Cholistan Desert. Tharparkar District is the largest of 29 districts in Sindh. According to Integrated Water Resource Management Practices to Alleviate Poverty – A Model of Desert Development in Tharparkar, Pakistan, the Thar is, people of Thar, have their livelihoods dependent on 'rainfall and livestock rearing, which is critical to household food security.'
When we think about geospatial technology, many of us imagine satellites for Earth observation and navigation, drones, and complex sensors used to collect information from the terrestrial surface. We also believe that most of the people capable of developing applications using geospatial data should hold a science-related Master or Ph.D. degree. The previous statement could not be further from the truth. Advances in technology have made access to geospatial technology possible for everybody.
Merci à Martin Sarret d'avoir traduit cet article volontairement.
Les caractéristiques élémentaires de l´agriculture nous viennent tous assez facilement à l´esprit. De larges étendues de terrain, d'imposantes machines de récolte, la chaleur du soleil sur la peau et, peut-être le plus important, la terre. Cette image mentale est finalement assez logique. L´humanité laboure, ensemence et cultive la terre depuis la nuit des temps, et les techniques agricoles industrielles modernes ont tendance à s'accaparer notre imaginaire sur l'agriculture.
Have you ever questioned if there would be enough food at the store for everyone in your community? If you frequent a grocery store or market, probably not. Every Sunday I go to the grocery store with a list of foods I’ll need for the week and no contingency plan for what to do if there isn’t enough. If something is out of stock, I’ll just go to the next grocery store down the road. We take it for granted that certain foods will always be available for us to purchase. However, many people do not have the luxury of a reliable food source.
This interview was conducted as part of the young professional program of the space4water program. The interview begins by asking about my professional and personal journey as a researcher specializing in water and space technologies, particularly in the context of environmental challenges. Growing up in Bangladesh, how my exposure to multiple water related challenges influenced my deep interest in remote sensing and Earth observation technologies. Then the question focuses on how I am addressing water related challenges using satellite imagery and geospatial data. The conversation also explores the role of space-based technologies, such as satellite Earth observations, in monitoring coastal erosion and riverbank changes. As part of response, I explain how the combination of high-resolution imagery with machine learning can predict environmental shifts and help mitigate the impacts on vulnerable populations. Finally, I shared my advice for aspiring professionals in water management, emphasizing the importance of interdisciplinary skills, including geospatial analysis, data science, and policy understanding. I also talked about the value of curiosity, collaboration, and access to advanced technologies for driving innovation in water related challenges worldwide.
Sarhan Zerouali became fascinated with water at a young age through learning about water scarcity around the world and about traditional methods for locating groundwater. In a space applications course Sahran then learnt about space-based technologies. He is currently working on a research project on how remote sensing and other technologies can help alleviate global challenges arising from land degradation. As an aerospace engineer, Sahran has worked with various modern technologies in his work including nanosatellites, artificial intelligence, and feature extraction algorithms.
Shaima Almeer is a young Bahraini lady that works as a senior space data analyst at the National Space Science Agency. At NSSA she is responsible for acquiring data from satellite images and analyzing them into meaningful information aiming to serve more than 21 governmental entities. Shaima is also committed to publishing scientific research papers, aiming to support and spread the knowledge to others.
In addition, she has recently graduated from a fellowship program at Bahrain’s Prime Minister’s Office. Shaima was selected among more than 1000 individuals to spend a year working as full-time research fellow, benefiting from advanced training in writing skills, research methods and policy analysis. The fellowship forms a core pillar of HRH the CP and PM initiative to improve national skills and support the Kingdom’s growing cadre of young government professionals. Part of the fellowship program is to work as a supervisor at the COVID-19 War Room.
Shaima has obtained her bachelor’s degree in the field of Information and Communication Technology from Bahrain Polytechnic and is currently pursuing her Msc. degree in Management Information System from the University College of Bahrain.
Prior to obtaining her bachelor’s degree, Shaima was titled as the first robotics programmer in the Kingdom of Bahrain and also won the title “Pioneering Women in Technology”. She has recently also won the “Women Innovator of the Year 2023 Award” in New Dehli.
This interview provides an in-depth look at my expertise and experience in water resource management, environmental conservation, and the integration of AI and remote sensing technologies in Burkina Faso. My passion for water management stems from my desire to protect precious resources and my belief in the essential importance of providing water to communities, a principle reinforced when I joined the Ministry of Agriculture in 2021.
As a Water and Environment Specialist at the General Office of Agro-Pastoral Development and Irrigation, I am responsible for irrigation systems, lowland rice-growing areas, and the protection of water infrastructure, while integrating innovation and remote sensing technologies to improve performance. My work also focuses on community conservation, including the removal of invasive aquatic plants from reservoirs and the treatment of gullies to combat soil erosion.
I have experience in remote sensing and AI-based applications such as ML and DL for monitoring flood risks, erosion, and irrigation systems. I use machine learning algorithms such as CNN, Random Forest, U-Net, and SVM to analyze satellite images, predict the spread of invasive plants, and optimize water use.
My research on integrating traditional knowledge into water management highlights the SoaSoagha concept, a collective work approach in Burkina Faso that promotes community conservation. Traditional rainwater harvesting, floodplain management, and small earthen dams (soussous) align with modern hydrological models, while sacred forests and customary water rights have been revealing, demonstrating indigenous methods of ecosystem protection.
My project on AI-powered aquatic invasive plant management integrates machine learning (Satellite image analysis to classify areas with a high probability of aquatic plant presence), deep learning (Precise segmentation of invasive plants, such as water hyacinth and others, in these identified areas), and community engagement to extract, classify, and convert plants into compost, biogas, and biochar. My work highlights the importance of combining technological innovation and traditional knowledge to strengthen climate resilience, ensure water security, and promote sustainable development in Burkina Faso and beyond.
Dr. Pietro Campana studied environmental engineering with a focus on fluid dynamics, hydrology, and water resource management, before undertaking a PhD on solar irrigation systems. He is working on the water-food-energy nexus and is currently evaluating the first agrivoltaic system (a photovoltaic system that allows the combination of both electricity production and crop production on the same land to increase the land use efficiency) in Sweden. He constantly strives to work on something that can make a difference to people’s lives and finds developing tools and services that can solve water issues very exciting. He believes that to address the nexus challenges, we need novel technologies and more research and development funding.
In the interview, Hafsa Aeman discusses her passion for integrating water resource management with space technologies. She uses remote sensing and AI to tackle challenges like seawater intrusion and coastal erosion, focusing on vulnerable coastal ecosystems. By leveraging satellite data, her work provides critical insights for sustainable water management, crucial for communities impacted by climate change.
Ms Aeman highlights the significant role of space technology in water management, especially through remote sensing, which helps monitor precipitation, soil moisture, and groundwater levels. Her proudest achievement is a publication on seawater intrusion, recognized for its innovative use of AI and remote sensing, contributing to Pakistan’s Living Indus initiative.
At the International Water Management Institute (IWMI), Hafsa’s research integrates AI and remote sensing to optimize water and irrigation management systems. She emphasizes the importance of addressing seawater intrusion, which poses threats to agriculture, ecosystems, and global food security.
She also underscores the role of community engagement in sustainable water management through capacity-building workshops for farmers, promoting smarter irrigation practices. She advocates for leadership opportunities for young scientists and believes AI can revolutionize water management by enabling more accurate and efficient data analysis. Rain, symbolizing renewal and sustenance, is her favorite aggregate state of water.
Joshua is a Master’s student in Tropical Hydrogeology and Environmental Engineering at Technische Universität of Darmstadt. His interest is focused on hydrogeological processes, groundwater modelling, application of remote sensing and GIS in environmental studies, water management and climate change. He also works as a graduate Intern at AgriWatch BV, a company that applies geospatial solutions for precision Agriculture. As a graduate intern, he applies his interdisciplinary knowledge in developing smart-farming solutions using space-based technologies to farmers in the Twente region of the Netherlands. He deploys satellite imagery, field studies and machine learning algorithms to predict the effect of climate change on arable crops. He also utilizes precipitation data to predict rainfall events to aid farmers in determining planting and harvesting periods.
Joshua earned a bachelor’s degree in Geological Sciences, his bachelor’s thesis research aimed at carrying out paleoenvironmental reconstruction using paleocurrent indicators of water flow and direction, and application of ArcGIS to produce maps. Currently, he is working on his master’s thesis with emphasis on the impact of the ancient climate on the paleoenvironment particularly on vegetation, where he tries to research plants response to long-term greenhouse periods and short-term warming events on various timescales throughout Earth's history.
His research interests revolve around the application of space technologies in providing solutions and tackling climate change.
Photo: Tääk ë´mëj (grandmother) cleansing her wooden cane. In Tamazulápam women guide the spiritual life of people in the community and teach younger generations the rituals and forms to interact with nature. Credits: Joselí Martínez-Vidal, Young Ëyuujk man from Tamazulápam del Espíritu Santo, Mixe, Oaxaca.
Sawaid Abbas, Assistant Professor at the Centre for Geographical Information System, University of the Punjab, Lahore, Pakistan discussed his extensive work in addressing water-related challenges through the nexus between smart sensing and space technologies. His thematic focus spans water scarcity, food security, climate risks, and environmental monitoring with an emphasis on the Asia-Pacific region, including Pakistan and China. Key Sustainable Development Goals (SDGs) guiding his work include SDG2 (Zero Hunger), SDG13 (Climate Action), SDG15 (Life on Land), and SDG11 (Sustainable Cities and Communities).
Abbas's passion for water emerged during his early career at the World Wide Fund for Nature (WWF), where he was involved in Pakistan’s Wetland Program and witnessed the impact of water on associated ecosystems. This sparked his interest in understanding and managing water, forestry, and wildlife resources. He recently studied coastal ecosystems and their responses to climate and anthropogenic stressors in the Asia-Pacific region. The Living Indus – Investing in Ecological Restoration has become a new focus of interest for him, addressing sustainability challenges related to food security, river basin management, and efficient water use in alignment with the UN Decade of Ocean objectives.
Abbas shared his fascination with water, recognizing its complex and essential nature. He is captivated by its beauty in all forms and acknowledges its fundamental importance for life on Earth. This water connection further motivates his commitment to addressing global water challenges and promoting sustainable water use through innovative solutions.
Sawaid Abbas's work, stimulated by both professional commitment and personal fascination, stresses the critical role of space technologies, particularly earth observation, smart sensing nexus, and artificial intelligence in addressing water-related challenges. His research contributes to the development of innovative solutions for sustainable water use, environmental protection, and disaster response, aligning with global goals for a more resilient and water-secure future.
Lukas Graf used to take clean drinking water for granted. As he grew up, and conversations around climate change and environmental destruction became increasingly intense, he started to become more aware of the importance and scarcity of water resources. Around a similar time, he became increasingly enthusiastic about space, realising that space technologies could be used to explore many of the pressing topics that he was interested in. He has participated in research projects that used remote sensing methods to study the effects of global change on ecosystems and especially on water availability. Lukas is interested in a range of topics from virtual water and water quality to irrigation and agriculture. He believes that interdisciplinary approaches and mutual dialog with societies and stakeholders need to be deepened for sustained resource management.
Rebecca Gustine is currently a PhD student at Washington State University in the Department of Civil and Environmental Engineering studying civil engineering with a focus on water resources. She is also an intern at NASA JPL where she is a member of the ECOSTRESS applied science mission team working with local agencies to inform resource management and conservation efforts. We talked to her about her interdisciplinary research experiences through her undergraduate and graduate school.
How do you professionally relate to water and/or space technologies?
As a hydrologist, I’ve always been fascinated by the potential of space technologies in transforming water resource management. My work integrates satellite-based Earth Observation (EO) data with hydrological modelling, particularly for drought and flood monitoring, and water availability assessments in regions with scarce ground data. EO technologies allow me to capture real-time, high-resolution data, critical for climate resilience, especially in Sub-Saharan Africa.
San José, Costa Rica, 7-10 May 2024 (with a possibility of online attendance)
Hosted and supported by the Inter-American Institute for Cooperation on Agriculture (IICA)
Co-sponsored by the Prince Sultan Bin Abdulaziz International Prize for Water (PSIPW)
Venue: Inter-American Institute for Cooperation on Agriculture Headquarters, San José, Costa Rica
Shaima Almeer is a young Bahraini lady that works as a senior space data analyst at the National Space Science Agency. At NSSA she is responsible for acquiring data from satellite images and analyzing them into meaningful information aiming to serve more than 21 governmental entities. Shaima is also committed to publishing scientific research papers, aiming to support and spread the knowledge to others.
In addition, she has recently graduated from a fellowship program at Bahrain’s Prime Minister’s Office. Shaima was selected among more than 1000 individuals to spend a year working as full-time research fellow, benefiting from advanced training in writing skills, research methods and policy analysis. The fellowship forms a core pillar of HRH the CP and PM initiative to improve national skills and support the Kingdom’s growing cadre of young government professionals. Part of the fellowship program is to work as a supervisor at the COVID-19 War Room.
Shaima has obtained her bachelor’s degree in the field of Information and Communication Technology from Bahrain Polytechnic and is currently pursuing her Msc. degree in Management Information System from the University College of Bahrain.
Prior to obtaining her bachelor’s degree, Shaima was titled as the first robotics programmer in the Kingdom of Bahrain and also won the title “Pioneering Women in Technology”. She has recently also won the “Women Innovator of the Year 2023 Award” in New Dehli.
This interview provides an in-depth look at my expertise and experience in water resource management, environmental conservation, and the integration of AI and remote sensing technologies in Burkina Faso. My passion for water management stems from my desire to protect precious resources and my belief in the essential importance of providing water to communities, a principle reinforced when I joined the Ministry of Agriculture in 2021.
As a Water and Environment Specialist at the General Office of Agro-Pastoral Development and Irrigation, I am responsible for irrigation systems, lowland rice-growing areas, and the protection of water infrastructure, while integrating innovation and remote sensing technologies to improve performance. My work also focuses on community conservation, including the removal of invasive aquatic plants from reservoirs and the treatment of gullies to combat soil erosion.
I have experience in remote sensing and AI-based applications such as ML and DL for monitoring flood risks, erosion, and irrigation systems. I use machine learning algorithms such as CNN, Random Forest, U-Net, and SVM to analyze satellite images, predict the spread of invasive plants, and optimize water use.
My research on integrating traditional knowledge into water management highlights the SoaSoagha concept, a collective work approach in Burkina Faso that promotes community conservation. Traditional rainwater harvesting, floodplain management, and small earthen dams (soussous) align with modern hydrological models, while sacred forests and customary water rights have been revealing, demonstrating indigenous methods of ecosystem protection.
My project on AI-powered aquatic invasive plant management integrates machine learning (Satellite image analysis to classify areas with a high probability of aquatic plant presence), deep learning (Precise segmentation of invasive plants, such as water hyacinth and others, in these identified areas), and community engagement to extract, classify, and convert plants into compost, biogas, and biochar. My work highlights the importance of combining technological innovation and traditional knowledge to strengthen climate resilience, ensure water security, and promote sustainable development in Burkina Faso and beyond.
In the interview, Hafsa Aeman discusses her passion for integrating water resource management with space technologies. She uses remote sensing and AI to tackle challenges like seawater intrusion and coastal erosion, focusing on vulnerable coastal ecosystems. By leveraging satellite data, her work provides critical insights for sustainable water management, crucial for communities impacted by climate change.
Ms Aeman highlights the significant role of space technology in water management, especially through remote sensing, which helps monitor precipitation, soil moisture, and groundwater levels. Her proudest achievement is a publication on seawater intrusion, recognized for its innovative use of AI and remote sensing, contributing to Pakistan’s Living Indus initiative.
At the International Water Management Institute (IWMI), Hafsa’s research integrates AI and remote sensing to optimize water and irrigation management systems. She emphasizes the importance of addressing seawater intrusion, which poses threats to agriculture, ecosystems, and global food security.
She also underscores the role of community engagement in sustainable water management through capacity-building workshops for farmers, promoting smarter irrigation practices. She advocates for leadership opportunities for young scientists and believes AI can revolutionize water management by enabling more accurate and efficient data analysis. Rain, symbolizing renewal and sustenance, is her favorite aggregate state of water.
Joshua is a Master’s student in Tropical Hydrogeology and Environmental Engineering at Technische Universität of Darmstadt. His interest is focused on hydrogeological processes, groundwater modelling, application of remote sensing and GIS in environmental studies, water management and climate change. He also works as a graduate Intern at AgriWatch BV, a company that applies geospatial solutions for precision Agriculture. As a graduate intern, he applies his interdisciplinary knowledge in developing smart-farming solutions using space-based technologies to farmers in the Twente region of the Netherlands. He deploys satellite imagery, field studies and machine learning algorithms to predict the effect of climate change on arable crops. He also utilizes precipitation data to predict rainfall events to aid farmers in determining planting and harvesting periods.
Joshua earned a bachelor’s degree in Geological Sciences, his bachelor’s thesis research aimed at carrying out paleoenvironmental reconstruction using paleocurrent indicators of water flow and direction, and application of ArcGIS to produce maps. Currently, he is working on his master’s thesis with emphasis on the impact of the ancient climate on the paleoenvironment particularly on vegetation, where he tries to research plants response to long-term greenhouse periods and short-term warming events on various timescales throughout Earth's history.
His research interests revolve around the application of space technologies in providing solutions and tackling climate change.
Lukas Graf used to take clean drinking water for granted. As he grew up, and conversations around climate change and environmental destruction became increasingly intense, he started to become more aware of the importance and scarcity of water resources. Around a similar time, he became increasingly enthusiastic about space, realising that space technologies could be used to explore many of the pressing topics that he was interested in. He has participated in research projects that used remote sensing methods to study the effects of global change on ecosystems and especially on water availability. Lukas is interested in a range of topics from virtual water and water quality to irrigation and agriculture. He believes that interdisciplinary approaches and mutual dialog with societies and stakeholders need to be deepened for sustained resource management.
Rebecca Gustine is currently a PhD student at Washington State University in the Department of Civil and Environmental Engineering studying civil engineering with a focus on water resources. She is also an intern at NASA JPL where she is a member of the ECOSTRESS applied science mission team working with local agencies to inform resource management and conservation efforts. We talked to her about her interdisciplinary research experiences through her undergraduate and graduate school.
How do you professionally relate to water and/or space technologies?
As a hydrologist, I’ve always been fascinated by the potential of space technologies in transforming water resource management. My work integrates satellite-based Earth Observation (EO) data with hydrological modelling, particularly for drought and flood monitoring, and water availability assessments in regions with scarce ground data. EO technologies allow me to capture real-time, high-resolution data, critical for climate resilience, especially in Sub-Saharan Africa.
This interview was conducted as part of the young professional program of the space4water program. The interview begins by asking about my professional and personal journey as a researcher specializing in water and space technologies, particularly in the context of environmental challenges. Growing up in Bangladesh, how my exposure to multiple water related challenges influenced my deep interest in remote sensing and Earth observation technologies. Then the question focuses on how I am addressing water related challenges using satellite imagery and geospatial data. The conversation also explores the role of space-based technologies, such as satellite Earth observations, in monitoring coastal erosion and riverbank changes. As part of response, I explain how the combination of high-resolution imagery with machine learning can predict environmental shifts and help mitigate the impacts on vulnerable populations. Finally, I shared my advice for aspiring professionals in water management, emphasizing the importance of interdisciplinary skills, including geospatial analysis, data science, and policy understanding. I also talked about the value of curiosity, collaboration, and access to advanced technologies for driving innovation in water related challenges worldwide.
Sarhan Zerouali became fascinated with water at a young age through learning about water scarcity around the world and about traditional methods for locating groundwater. In a space applications course Sahran then learnt about space-based technologies. He is currently working on a research project on how remote sensing and other technologies can help alleviate global challenges arising from land degradation. As an aerospace engineer, Sahran has worked with various modern technologies in his work including nanosatellites, artificial intelligence, and feature extraction algorithms.
Photo: Tääk ë´mëj (grandmother) cleansing her wooden cane. In Tamazulápam women guide the spiritual life of people in the community and teach younger generations the rituals and forms to interact with nature. Credits: Joselí Martínez-Vidal, Young Ëyuujk man from Tamazulápam del Espíritu Santo, Mixe, Oaxaca.
This learning platform helps users understand the significance of Earth observations, explore Digital Earth Africa datasets through an interactive map, and get started on the basics of python coding for spatial analysis.
Digital Earth Africa makes Earth observation (EO) data readily available, delivering decision-ready products to the African continent. Data generated by Digital Earth Africa will provide valuable insights for better decision-making across many areas, including resource management, food security and urbanisation.
Develop skills to use remote sensing for land cover classification, estimating evapotranspiration, water productivity, irrigation performance assessment & irrigation water accounting.
This online training introduces participants to the data and applications of the Global Precipitation Measurement (GPM) mission. GPM is an international satellite mission that provides next-generation observations of rain and snow worldwide every three hours.
The Jupyter notebook demonstrates how EOdal can be used for disaster relief after the break of the Kachowka using open-source Earth Observation data.
On June 6, 2023, the Kakhovka Dam in Ukraine broke. We do not yet know who or what was responsible for the collapse of the dam. What we do know, however, are the devastating consequences for the region downstream - especially for the local population.
This workshop has brought together an international expert group of remote sensing (RS) specialists, water resources experts and water quantity modelers. This workshop has focused on:
This learning platform helps users understand the significance of Earth observations, explore Digital Earth Africa datasets through an interactive map, and get started on the basics of python coding for spatial analysis.
Digital Earth Africa makes Earth observation (EO) data readily available, delivering decision-ready products to the African continent. Data generated by Digital Earth Africa will provide valuable insights for better decision-making across many areas, including resource management, food security and urbanisation.
The first GEO Knowledge Hub (GKH) webinar, on the 24th February 2021, introduced the GKH in its current stage of development.
Objective
The goal was to provide a user perspective based on input from the Knowledge Providers, notably to outline GKH capabilities and benefits to the GEO community.
During this webinar, we will be discussing water quality (run-off from agriculture, pollution of surface water for irrigation) and quantity of water (drought, extreme rainfall, groundwater level, soil moisture) to tackle the water and agriculture domains for the Copernicus Roadmap.
Water problems around the world are increasing; however, information useful for decision makers within the water sector and related to the water sector seems to be decreasing. Solving water problems requires information from many disciplines, and the physical accounts (describing sources and uses of water) are the most important foundation. The information has to be coherent and harmonized in order to provide an integrated picture useful for the assessment of the problems.
Currently, WHOS makes available three data portals allowing users to easily leverage common WHOS functionalities such as data discovery and data access, on the web by means of common web browsers. For more information on WHOS data and available tools, please refer to the Section WHOS web services and supported tools.
WHOS-Global Portal provides all hydrometeorological data shared through WHOS. WHOS-Global Portal is implemented using the Water Data Explorer application.
Decision-makers are faced with the constant challenge of maintaining access to and understanding new technologies and data, as information and communication technologies (ICTs) are constantly evolving and as more and more data is becoming available. Despite continually improving technologies, informed decision-making is being hindered by inadequate attention to enabling conditions, e.g. a lack of in-service education and professional training for decision-makers.
Founded by Central European University (CEU), American University of Central Asia (AUCA), and Bard College, GeoHub is an open platform project developing the capacity of the members of the Open Society University Network (OSUN) for using the latest geospatial methods and technologies in their core research and teaching disciplines.
e-shape is a unique initiative that brings together decades of public investment in Earth Observation and in cloud capabilities into services for the decision-makers, the citizens, the industry and the researchers. It allows Europe to position itself as global force in Earth observation through leveraging Copernicus, making use of existing European capacities and improving user uptake of the data from GEO assets. EuroGEO, as Europe's contribution to the Global Earth Observation System of Systems (GEOSS), aims at bringing together Earth Observation resources in Europe.
The emerging demand of GIS and Space Applications for Climate Change studies for the socio-economic development of Pakistan along with Government of Pakistan Vision 2025, Space Vision 2047 of National Space Agency of Pakistan, and achievement of UN Sustainable Development Goals (SDGs) impelled the Higher Education Commission of Pakistan (HEC) to establish Remote Sensing, GIS and Climatic Research Lab (RSGCRL) at University of the Punjab, Lahore, Pakistan.
The Inter-American Institute for Cooperation on Agriculture (IICA) is the specialized agency for agriculture of the Inter-American System that supports the efforts of Member States to achieve agricultural development and rural well-being.
G. B. Pant University of Agriculture and Technology, also known as Pantnagar University, is the first agricultural university in India. The University lies in the campus town of Pantnagar in Kichha Tehseel and in the district of Udham Singh Nagar, Uttarakhand. The university is regarded as the harbinger of the Green Revolution in India. Pantnagar University is regarded as a significant force in the development and transfer of High Yielding Variety of seeds and related technology.
The United Nations University Institute on Comparative Regional Integration Studies (UNU-CRIS) is a research and training institute of the United Nations University. UNU is a global network of institutes and programs engaged in research and capacity development to support the universal goals of the UN. It brings together leading scholars from around the world with a view to generate strong and innovative knowledge on how to tackle pressing global problems. UNU-CRIS focuses on the study of processes of global cooperation and regional integration and their implications.
mWater is an operating system for digital governance used by governments, civil society organizations, and water and sanitation service providers in over 190 countries. The platform's free features allow users to collect data using smartphones, bring in data from Earth observations and other sources, and create effective analytics and visualizations to help prioritize interventions. mWater is designed to facilitate collaboration and longitudinal monitoring of individual pieces of infrastructure as well as entire water systems.
Imagery from Earth observing (EO) satellites combined with environmental data about climate, topography and soils holds great potential to advance our knowledge about the dynamics of our planet. Still, the handling and analysis of these data sources is cumbersome and presents a high barrier to entry leaving the potential of EO data underexploited.
To address the challenge of water security in Bahrain, this solution integrates space-based technologies and geospatial analysis to identify and monitor potential water resources, particularly shallow groundwater. The methodology involves the use of satellite-derived datasets and terrain modelling tools to analyse hydrological behaviour, soil moisture, and elevation-based drainage characteristics.
Three main data sources were incorporated into the solution:
GRACE (Gravity Recovery and Climate Experiment) data is used to assess changes in terrestrial water storage at the regional scale by detecting gravity anomalies related to mass variations in groundwater. GRACE data is retrieved and visualised through platforms such as Google Earth Engine and ArcGIS Pro, enabling temporal monitoring of water resources.
HAND (Height Above Nearest Drainage) modelling was employed to identify topographic wetness and assess the hydrological potential of the landscape. HAND normalises elevation relative to the nearest drainage, highlighting areas where water is more likely to accumulate or infiltrate. This method supports the identification of suitable zones for groundwater recharge, such as infiltration basins or artificial wetlands, especially in an arid environment like Bahrain. The HAND model was derived using the GLO-30 Copernicus DEM (2023_1 DGED version), processed through the TerraHidro platform, and included the generation of essential layers such as flow direction (D8), contributing area (D8CA), slope, and drainage networks with thresholds of 10, 100, and 300 pixels.
Soil moisture analysis was conducted using two approaches:
SAR (Synthetic Aperture Radar) data from the Sentinel-1 constellation, which provides all-weather, day-and-night measurements of surface moisture conditions.
Optical-based soil moisture estimation, calculated from Landsat-8 imagery using vegetation and thermal indices (e.g., Normalized Difference Vegetation Index (NDVI), Land Surface Temperature (LST)). This dual approach allows for consistent monitoring of surface moisture, which is crucial for assessing recharge potential and supporting irrigation planning.
Together, these tools provide a multi-faceted view of Bahrain's hydrological landscape, enabling decision-makers to strategically identify areas with groundwater potential and implement more sustainable water resource management practices.
Solution requirements
Gravity Recovery and Climate Experiment (GRACE)
GRACE is a joint mission by the National Aeronautics and Space Administration (NASA) and the German Aerospace Center (DLR) to measure Earth's gravity field anomalies from its launch in March 2002 to the end of its mission in October 2017. The GRACE Follow-On (GRACE-FO) is a continuation of the mission launched in May 2018. GRACE provides information on how mass is distributed and is varied over time through its detection of gravity anomalies. Because of this, a significant application of GRACE is groundwater anomalies detection. Hence, GRACE data has been explored as a solution for this challenge.
Two software platforms have been utilised to download and visualise GRACE data for Bahrain:
Google Earth Engine (GEE): A cloud-based platform that facilitates remote sensing analysis with a large catalogue of satellite imagery and geospatial datasets. The platform is free for academic and research purposes.
QGIS: A desktop application that allows the exploration, analysis and visualisation of geospatial data. This application is open source.
Height Above Nearest Drainage (HAND)
The Height Above Nearest Drainage (HAND) is a terrain model that normalises elevation data relative to the local drainage network, offering a hydrologically meaningful representation of the landscape. By calculating the vertical distance between each point on the terrain and the nearest drainage channel, HAND allows for the identification of topographic wetness zones and the classification of soil water environments. It has shown strong correlation with water table depth and has been effectively validated in various catchments, particularly in the Amazon region. The HAND model supports physically based hydrological modelling and has broad applicability in areas such as flood risk assessment, soil moisture mapping, and groundwater dynamics, using only remote sensing-derived topographic data as input.
Soil moisture using Synthetic Aperture Radar (SAR) imagery
SAR data from Sentinel-1 constellation was used to generate relative soil moisture values. Seninel-1 is a radar-based satellite which acquires data with 6 days repeat cycle, and is neither affected by clouds, weather nor time of the day. Being a dual-polarimetric platform, it acquires data in VV (Vertical-transmit and Vertical received) polarization and VH (Vertical-transmit and Horizontal received) polarization. The data was analysed in GEE.
Soil moisture using multispectral and thermal imagery (Optical)
The data utilised to detect soil moisture are satellite imagery from Landsat-8 downloaded through GEE. Landsat-8 provides multispectral and thermal satellite imagery with 16 days repeat cycle. The specific bands required to calculate soil moisture index are the red, near-infrared bands and thermal infrared bands.
Solution outline and steps
GRACE
Figure 1 illustrates the steps taken to extract the recent GRACE Monthly Mass Grids Version 04 - Global Mascon (CRI Filtered) Dataset from GEE.
Figure 1. Download steps for GRACE Data
HAND
The elevation data downloaded and processed for the region of interest were derived from the GLO-30 dataset. The Copernicus DEM, a Digital Surface Model (DSM), represents the Earth's surface, including features such as buildings, vegetation, and infrastructure. This DSM is based on the WorldDEM product, which has undergone extensive editing to ensure the flattening of water bodies, consistent river flow representation, and correction of terrain anomalies, including shorelines, coastlines, and features like airports. The WorldDEM itself was generated using radar satellite data from the TanDEM-X mission, a Public Private Partnership between the German Aerospace Centre (DLR) and Airbus Defence and Space. The GLO-30 data used in this work corresponds to the 2023_1 version of the Defence Gridded Elevation Data (DGED), provided via ESA’s https PRISM service and made accessible through OpenTopography.
The following products were processed using the TerraHidro software from the GLO-30 dataset: removepits.tif, d8.tif, d8ca.tif, slope.tif, drainage_10.tif, drainage_100.tif, and drainage_300.tif, as well as the HAND-derived products hand_10.tif, hand_100.tif, and hand_300.tif. Each product has a specific role in hydrological modeling:
removepits: This process modifies the original Digital Elevation Model (DEM) to eliminate depressions or pits that are not hydrologically realistic, ensuring that every cell has a defined downstream flow direction.
d8: The D8 (Deterministic 8) flow direction model calculates the steepest descent path from each pixel to one of its eight neighbors, indicating the primary direction of surface water flow.
d8ca: The D8 Contributing Area represents the number of upstream cells that contribute flow to each cell, allowing the identification of areas of potential accumulation and drainage.
slope: This product calculates the slope of the terrain in degrees, essential for understanding runoff velocity and erosion potential.
drainage_10, drainage_100, and drainage_300: These are drainage networks derived from the D8 contributing area, using threshold values of 10, 100, and 300 pixels, 0.9ha, 9ha and 27ha, respectively. They represent streams formed when the contributing area exceeds the specified number of pixels, with higher thresholds resulting in more generalised drainage networks.
From these products, the following HAND (Height Above Nearest Drainage) models were generated:
hand_10, hand_100, and hand_300: These datasets represent the vertical distance (in meters) from each pixel to the nearest drainage cell identified in the corresponding drainage network (with thresholds of 10, 100, and 300 pixels, respectively). These HAND maps are used to characterise terrain wetness, identify flood-prone areas, and support soil moisture and hydrological modeling.
Several steps were executed to derive the mean soil moisture conditions over the study area between 2017 and 2024. A step-by-step guide is shown in Figure 2. The values of soil moisture estimated is relative to the maximum soil moisture recorded in the region such that the wettest will be the maximum and the driest will be the minimum. These are used to normalise the final output into values between 0 and 1 where 0 is the driest and 1 is the wettest.
Figure 2. Processing steps for SAR soil moisture
Soil moisture (Optical)
Similar to the soil moisture calculation with SAR, an average of the soil moisture from 2017 to 2024 has been derived. The interrelations between the derived vegetation through the Normalized Difference Vegetation Index (NDVI) as well as Land Surface Temperature (LST) have been the basis for generating the soil moisture map. Figure 3 demonstrates the steps followed to generate optical soil moisture.
Figure 3. Processing steps for optical soil moisture
Shallow groundwater locations/recharge areas
To estimate potential suitable locations for shallow groundwater or groundwater rechange, the results from the HAND, SAR and optical soil moisture have been aggregated to formulate a final classification map. To perform this, the following has been done:
Classification of HAND, SAR and optical soil moisture results to ranges from 1-5, with 5 being the most suitable region based on the related values.
Spatial modelling of these three classifications to formulate a final suitability value from 1-5 with 5 being the most suitable region overall. HAND has been given a weightage of 50 per cent while SAR and optical soil moisture have been given a weightage of 25 per cent each to represent 50 per cent overall for soil moisture.
Map generation
Different maps have been generated for each component of this solution (HAND, SAR soil moisture, optical soil moisture, shallow groundwater locations/recharge areas). The subsequent steps illustrate the steps needed to develop the maps for this solution:
A basemap is added to the map for visualisation purposes. This is done through using the QGIS plugin called QuickMapServices. To install plugins, go to the Plugins tab and select Manage and Install Plugins.
Figure 4. Map generation - Step 1
In the search box of the Plugins window, search for QuickMapServices and install the plugin.
Figure 5. Map generation - Step 2
The plugin logo should appear in the QGIS panel. Click on the logo for Search QMS Panel. This label would appear if you hovered over the logo.
Figure 6. Map generation - Step 3
In the Search QMS Panel on the right, search for Google Satellite and add the basemap. It should appear in the list of layers.
Figure 7. Map generation - Step 4
Now we have a base layer that we can place our analysis on top of. Add the layer to the QGIS project if it is not already added. This can be done through drag and drop.
Figure 8. Map generation - Step 5
Right click on the layer and select Properties to adjust visualisation parameters.
Figure 9. Map generation - Step 6
In the Layer Properties window, click on Symbology and discover the most appropriate visualisation method for the data layer. This is an example for the set classifications for the HAND.
Figure 10. Map generation - Step 7
Once the layer visualisation has been set, the map layout can be generated. Go to Project > New Print Layout and name the layout.
Figure 11. Map generation - Step 8
Figure 12. Map generation - Step 8
In the Layout window, items such as the layers map, legend, scales can be added. This is accessed through the Add Item tab.
Figure 13. Map generation - Step 9
The items added to the map can then be moved and arranged by selecting the Edit tab then either Select/Move Content to move the locations of the specific content or Move Content to move the position/scale of the map.
Figure 14. Map generation - Step 10
Each item’s properties such as size, colour and fonts can also be edited in the Item Properties panel in the right.
Figure 15. Map generation - Step 11
The final generated layout is then exported in the desired format: png, pdf or svg. This is achieved through clicking on the Layout tab.
Figure 16. Map generation - Step 12
Results and maps
GRACE
The GRACE data has been downloaded and analysed through GEE. The main limitation of this dataset is its course resolution of 55.6 km2 as downloaded from the platform. This is due to the small geographical area of Bahrain at around 800 km2, causing water storage monitoring in specific locations to be a difficult task. Figure 17 demonstrates the span of GRACE data relative to the area of Bahrain.
Figure 17.GRACE Mascon- 2002 to 2024 Bahrain
HAND
The HAND model shown in the figure 18 provides valuable insights for addressing water scarcity in Bahrain. The low-lying areas highlighted in blue indicate regions where water tends to accumulate or water table is relatively shallow, suggesting potential zones for managed aquifer recharge (MAR) or stormwater harvesting. These areas could be prioritised for infiltration basins, recharging wells, or constructed wetlands to enhance groundwater storage. Conversely, the higher elevation zones in grey are less likely to retain surface water but could be strategically used for runoff collection and diversion to recharge areas. Given Bahrain’s arid climate and dependence on non-conventional water sources, integrating HAND-based terrain analysis into water resource planning can support more resilient, localised, and efficient water management strategies, particularly in optimising land use for recharge, storage, and flood mitigation purposes.
Figure 18. HAND results map
Soil moisture (SAR)
Figure 19 shows the mean soil moisture values of different regions of Bahrain. The southern regions seem to be drier while most central regions are wet. The analysis excluded urban regions.
Figure 19. SAR soil moisture results map
Soil moisture (Optical)
Figure 20 illustrates the soil moisture map with optical imagery for Bahrain. The results here highlight the northern west regions with high soil moisture values and the central, southern regions as dry with some specific location in the central and southern regions as wet.
Figure 20. Optical soil moisture results map
Shallow groundwater locations/recharge areas
Through Figure 5, the combinations of HAND, SAR and optical soil moisture has yielded to the potential locations for shallow groundwater locations/recharge areas. The areas highlighted in red represent the locations with highest potential.
Figure 21. Shallow groundwater locations/recharge areas results map
Solution impact
With the establishment of a methodology that identifies locations of shallow groundwater or recharge, significant information is being derived about the hydrological state of the country. This importance is placed due to the lack of remote sensing data that enables direct measurement of groundwater in the area. Hence the information extracted from this methodology can be initially integrated with sample in-situ data to calibrate the model; and then, be relied on solely for future measurements. Additionally, with the country’s rigorous focus on addressing groundwater scarcity, this type of information can greatly support decision-making when it comes to the formulation and execution of different projects and policies related to this matter.
Future work
To enhance the accuracy, applicability, and long-term impact of this solution in addressing water scarcity in Bahrain, several future developments are proposed:
Integration of additional remote sensing products: Incorporate higher-resolution satellite data to improve spatial resolution in soil moisture and elevation analyses, enabling finer-scale hydrological modeling and more localised identification of recharge zones. Moreover, the inclusion of land cover and geological characteristics can enhance the spatial modelling conducted.
Validation with in-situ data: Collaborate with local water authorities to collect and integrate ground-truth data such as groundwater levels, soil profiles, and well yields to validate and calibrate the HAND model and soil moisture outputs. This is also vital to assess the suitable weightage and classification for spatial modelling to be done to combine all three products generated.
Development of a Decision Support System (DSS): Create an interactive platform or dashboard that integrates HAND, GRACE, and soil moisture maps to assist policymakers in identifying priority areas for groundwater recharge, stormwater harvesting, and drought preparedness.
Temporal analysis and trend monitoring: Implement time-series analyses of GRACE and soil moisture data to detect trends, seasonal variations, and anomalies in water availability, supporting early warning systems and long-term planning.
Hydrological modelling coupling: Link HAND-derived terrain data with physically based hydrological models (e.g., SWAT, DHSVM) to simulate runoff, infiltration, and recharge scenarios under different land use and climate conditions.
Community engagement and capacity building: Conduct training workshops and knowledge-sharing activities with national institutions and stakeholders to build local capacity in geospatial water resource monitoring using open-source and space-based tools.
By pursuing these developments, the solution can evolve into a comprehensive and replicable model for sustainable groundwater resource management in water-scarce regions worldwide.
Relevant publications
Related space-based solutions
Sources
Nobre, A. D., Cuartas, L. A., Hodnett, M., Rennó, C. D., Rodrigues, G., Silveira, A., Waterloo, M., & Saleska, S. “Height Above the Nearest Drainage – a hydrologically relevant new terrain model.” Journal of Hydrology 404, no. 1–2 (2011): 13–29. https://doi.org/10.1016/j.jhydrol.2011.03.051.
The proposed solution leverages Earth Observation (EO) and climate data to develop a machine learning-based irrigation demand forecasting system tailored for smallholder farmers operating under the Warabandi system. In regions where rotational irrigation governs water distribution, farmers often lack accurate tools to forecast short-term irrigation needs, leading to overuse or underuse of water, both of which impact productivity and efficiency. This space-based solution addresses the challenge by integrating EO-derived variables such as Normalized Difference Vegetation Index (NDVI), Soil-Adjusted Vegetation Index (SAVI), Land Surface Temperature (LST), and net radiation to estimate actual crop water requirements. The model enables data-driven decision-making for farmers and water managers, promoting more efficient and timely irrigation practices within fixed rotation systems.
Donor: Water Resource Accountability in Pakistan (WRAP), supported by the Foreign, Commonwealth & Development Office (FCDO)
Government Departments Involved: On-Farm Water Management (OFWM), Agriculture Department and Irrigation Department, Punjab
Community and Sectoral Engagement: Farmers’ associations and local water user groups, experts in water demand management from academia and the private sector
Inclusive Participation: Integrating voices from underrepresented communities, including women and Indigenous stakeholders.
Requirements
Data
Landsat time series
PlanetScope time series
Climate data: ERA5 (Copernicus), Flux Tower System (for validation)
Crop calendar and landcover data integrated with ML models
Google Colab: Python-based model training and automation
Python, TensorFlow/PyTorch for ML model setup
Physical
Validation of land cover features, historical crop water use, and weather parameters through ground-based systems such as flux tower, along with crop information verified using crop calendars and spectral signatures collected from the field.
The information regarding soil moisture will be verified through Soil moisture sensors.
Outline steps for a solution
Data collection and sourcing (Completed)
Workflow development and EO dataset integration (In progress)
Data loader development and ML model setup (Completed)
Training and initial testing of ML models (Completed)
Automation of input data prediction via GEE/Colab (To do)
Continuous irrigation forecast generation and output delivery (To do)
Steps to a solution
The solution workflow begins by collecting and preprocessing key spectral indices derived from historical satellite datasets. These include Normalized Difference Vegetation Index (NDVI), Soil-Adjusted Vegetation Index (SAVI), Land Surface Temperature (LST), Land Use Land Cover (LULC), and Net Radiation (Rn) data. This includes the:
Dataset Preparation:
Extract temporal identifiers from each dataset.
Group datasets by matching dates across all indices and the target variable Evapotranspiration (ET).
Data pre-processing to clean datasets to remove NaN values and outliers for consistent temporal-spatial alignment.
Model Development:
Features are stacked into multi-channel tensors for CNN models (e.g., 5 input channels for NDVI, SAVI, LST, Rn, and LULC).
For Random Forest models, the same data is flattened into tabular format with each pixel representing a row.
Convolutional Neural Network (CNN):
A deep CNN model is trained with 5 layers including convolution (Conv2D) and Batch Normalization, activated using ReLU functions.
The final layer outputs a single channel of predicted Evapotranspiration (crop water requirement) for each crop pixel by pixel.
Random Forest Ensemble:
A bootstrapped ensemble of Random Forest regressors is trained on flattened data.
Each model votes on ET prediction, and the final output is an average of these predictions
Results
Initial model testing achieved accurate crop water requirement estimation using CNN and ML. Results indicated high R² values (e.g., NDVI = 0.81, SAVI = 0.81, Net Radiation = 0.83, LST = 0.78). A 7-day irrigation forecast was generated for rice, providing actionable advisories. The model testing phase has been completed and is now in the process of being brought into a continuous irrigation advisory system to generate crop driven irrigation forecasts.
The irrigation demand forecasting model was validated across two cropping seasons with Kharif (June 2024) and Rabi (February 2024), using observed evapotranspiration (ET) from PySEBAL and flux tower data. During the Kharif season, CNN predictions closely aligned with observed ET for rice (CNN: 6.798 mm/day vs. PySEBAL: 6.370 mm/day; Flux Tower: 6.99 mm/day), while RF and XGB models showed moderate underestimations.
Similarly, in the Rabi season, wheat ET prediction by CNN (2.041 mm/day) was close to the flux tower estimate (1.86 mm/day), with XGB and RF providing slightly conservative outputs. Across both seasons, CNN consistently performed better in spatial alignment and magnitude, demonstrating its robustness in capturing seasonal irrigation demand variations across diverse crops like maize, potato, guava, and citrus orchards.
Wetlands are some of the most important habitats in the ecosystem, with the most diverse group of organisms. Wetlands are transition points between land and water. Due to pollution and climate change, our wetlands are diminishing at a geometric rate. There is an urgent need for restoration of these wetlands to encourage plant and animal diversity and ultimately ensure sustainability. Its noticed that most of the swampy lands (wetlands) in the eastern part of Kogi state of Nigeria are diminishing very quickly. Wetlands are important to the environment because they help keep nature balanced and clean. Furthermore, they serve as a buffer zone for flood hazards in a catchment. The wetlands in the eastern part of Kogi state are mostly used for agriculture, as some crops are well suited to that type of water-logged soil. Recently (In the last 20 years, the wetlands in the region have started to disappear at a geometric rate. This disappearance of wetlands is probably caused mainly by climate change or pollution and will prevent the attainment of SDGs 1,2,6,11,12,13,14,15.
Problem Statement
Among the most productive ecosystems in the world, wetlands offer vital functions such as flood control, carbon sequestration, water filtering, and a biodiverse habitat. Wetlands in states like Kogi, Benue, Plateau, and Niger in North Central Nigeria are essential to local livelihoods, agriculture, and fisheries. However, a combination of increasing environmental degradation, the effects of climate change, and human activities like inadequate water resource management and agricultural development is causing these habitats to disappear quickly. The degradation of wetlands in this region is driven by several interconnected factors. Wetland regions are disappearing as a result of rising pollution, deforestation, and land conversion for industrial and urban purposes. Wetland hydrology is changing due to rising temperatures, unpredictable rainfall patterns, and protracted droughts, which reduces the capacity of these ecosystems to support biodiversity and offer ecosystem services. Wetland degradation and loss have been exacerbated by the drainage and conversion of wetlands for agricultural purposes, driven by the growing demand for arable land. The natural flow of water into wetlands has been disturbed by poor water resource management, including the construction of dams and extraction of large amounts of water. The result of the shrinking of wetlands, which are home to rare plants and animals, is the loss of biodiversity. Insufficient comprehension of the intricate connections between human endeavors and wetland ecosystems has led to unsustainable behaviors that cause harm. Despite their ecological and socio-economic importance, there is limited research on the extent, drivers, and impacts of wetland loss in North Central Nigeria. Existing studies have largely focused on other regions, such as the Niger Delta, leaving a significant gap in understanding the dynamics of wetland degradation in this area. The lack of detailed geospatial data and comprehensive analysis hinders the development of effective conservation strategies and policy interventions. The disappearance of wetlands in North Central Nigeria has far-reaching consequences, including reduced water quality, loss of biodiversity, increased vulnerability to flooding, and diminished livelihoods for local communities. Without urgent action, the continued degradation of these ecosystems will exacerbate environmental and socio-economic challenges, particularly in the face of climate change.
Research Objectives
This research seeks to address this gap by achieving the following main objectives. By achieving these objectives, this research will contribute to a deeper understanding of wetland dynamics in North Central Nigeria and provide actionable recommendations for sustainable management and conservation.
1. Map the spatial extent of wetlands and document wetland transformation.
Apply supervised classification using algorithms like Random Forest (RF) in Google Earth Engine
Use NDWI, MNDWI, and SMI spectral indices to help identify water and moist soil features.
Perform accuracy assessment with confusion matrices and field-collected points
2. Analyze temporal changes in wetland areas: Assess how wetland areas have changed over time, using historical and current data. Identify and record the drivers and patterns of wetland loss and degradation in the region.
Perform post-classification comparison of the classified maps for each time period.
Generate change maps to show wetland loss, gain, or transformation (e.g., to farmland, built-up, etc.).
Calculate area statistics for each class and change category using GEE.
3. Provide Scientific Evidence for Conservation Efforts: Generate data-driven insights to support the development and implementation of effective wetland conservation strategies.
Expected outcomes of the space-based solution developed in the context of Space4Water
Quantify wetland loss over time since 1995
Determine trends in wetland change
Create comprehensive geospatial documentation
Assist with conservation and environmental policy which will establish baseline information for ecological restoration
Literature Review
Ogunlade (2024) conducted a geospatial analysis of wetland distribution in Ilaje Local Government Area, Ondo State, Nigeria, using remote sensing and geospatial techniques such as NDVI, NDWI, NDMI, and NDBI. Although the study focused on southern Nigeria, its methodology and findings are relevant to understanding wetland dynamics in North Central Nigeria. The study revealed significant transformations in wetland areas, with an increase from 253.1 km² in 1986 to 354.8 km² in 2015, followed by a decline to 318.14 km² by 2019. The study projected ongoing changes by 2030, emphasizing the need to control urban encroachment to mitigate environmental hazards like flooding and soil erosion. Tobore et al. (2021) assessed the suitability of wetland soils for rice production in Ajibode, Nigeria, using GIS and remote sensing. The study analyzed Landsat 7 and 8 imagery from 2000 and 2016, alongside soil sampling, to evaluate land use changes and soil properties. Findings indicated that 75% of the soils were marginally suitable for rice production, while 20% were unsuitable. The study highlighted the importance of geospatial techniques in guiding land use decisions to sustain agricultural productivity (Tobore et al., 2021). This study is particularly relevant to North Central Nigeria, where agriculture is a major driver of wetland loss. Abubakar and Abdussalam (2024) analyzed land use changes and wetland dynamics in Kaduna Metropolis using Landsat TM/OLI imagery and SRTM DEM data. The study found a significant increase in built-up areas (194.9 km²) and a corresponding decline in wetlands, with marshlands losing 15 km² and riparian vegetation declining by 28.6 km². Urban expansion and agricultural activities were identified as primary drivers of wetland loss, underscoring the need for sustainable land use planning (Abubakar & Abdussalam, 2024). While Kaduna is in the Northwest, the findings are applicable to North Central Nigeria, where similar trends are observed. Lin and Yu (2018) investigated the loss of natural coastal wetlands in three Chinese coastal city clusters (Bohai Rim, Yangtze River Delta, and Pearl River Delta) from 1990 to 2015. The study attributed wetland loss to land conversion for agriculture and urban development, as well as ecological degradation from water pollution. The Bohai Rim experienced the highest land conversion loss, while the Yangtze River Delta faced severe ecological degradation due to pollution from inland rivers. The study emphasized the role of regional economic development in driving wetland loss and called for integrated conservation strategies (Lin & Yu, 2018). Although focused on China, the study's findings on the drivers of wetland loss are relevant to North Central Nigeria, where similar factors are at play. Akei and Babila (2022) examined wetland dynamics in Bamenda II and III Municipalities, Cameroon, using satellite imagery and field surveys. Wetlands in Bamenda II decreased from 33.91 km² in 1980 to 28.58 km² in 2020, while Bamenda III experienced a more severe decline from 13.58 km² to 9.09 km². Rapid urbanization, pollution, and biodiversity loss were identified as key drivers. The study highlighted the environmental consequences, including habitat loss and increased flooding, and advocated for both engineering and non-engineering adaptation strategies (Akei & Babila, 2022). These findings are relevant to North Central Nigeria, where urbanization and pollution are significant threats to wetlands. Several studies have demonstrated the effectiveness of using Landsat imagery combined with machine learning techniques for wetland mapping and monitoring. Xie et al. (2019) utilized Landsat-8 data with classifiers such as Random Forest and Support Vector Machines to classify wetlands in the Canadian Prairie Pothole Region, achieving high accuracy despite the complexity of wetland spectral signatures. Similarly, Wang et al. (2018) applied Random Forest to Landsat time-series data to monitor wetland changes in China’s Sanjiang Plain, achieving classification accuracy above 85%. These studies underscore the potential of Landsat-based machine learning approaches for accurate, scalable, and cost-effective wetland monitoring and conservation planning. These technologies could be applied in North Central Nigeria to improve wetland monitoring and management.
Research Methodology
Study Area
Kogi State lies between latitudes 6°30′N and 8°40′N and longitudes 5°10′E and 8°10′E, The ground elevations range between 140 and 300 m above sea level (Ifediegwu et al., 2019). The climate of the study area is designated as Sub-Humid (AW by Koppen classification). Kogi state, is found in the Guinea savannah region with the presence of gallery forest along water courses (riparian vegetation). Time period to be studied is 30years (1995 - 2025)
ibaji Area,kogi State
Suggested solution
This ongoing project uses a space-based solution to monitor and analyze the disappearing wetlands in North Central Nigeria, particularly in Ibaji, Kogi State. collaborators have extended the methodology by incorporating wet season composites (e.g., WaterMasks_1995_2024_Fixed_Threshold_v2) to differentiate between temporary and permanent water bodies. Due to limited access to high-resolution training and validation data and time constraints, the team is currently adopting a thresholding approach to identify annual water extent patterns.
The analysis leverages Google Earth Engine and Landsat archives, focusing on changes in surface water extent over a 30-year period. The ultimate goal is to generate consistent, interpretable insights into wetland dynamics—providing a foundation for long-term conservation strategies, policy action, and ecological restoration .
Step-by-Step development of the solution to document wetland transformation
Description of all the steps to get to a solution
Study area definition (completed)
Data Acquisition (completed)
Preprocessing (in progress)
Feature extraction (in progress)
Classification of land cover mapping (in progress)
Accuracy Assessment (in progress)
Map Generation and Export (in progress)
Temporal and spatial analysis (in progress)
Reporting and interpretation (in progress)
1. Study area definition
Identify and define the geographic boundary of the wetland area using shapefiles or administrative boundary data.
For this project, the focus area is Ibaji in Kogi State, North Central Nigeria which can be loaded from the "FAO/GAUL/year/level2" data
Figure 1: study area map
2. Data Acquisition
Access satellite imagery through Google Earth Engine (GEE) for the years 1995, 2005, 2015, 2025
Use Landsat 5, 7, 8, or 9 imagery for historical and current data
Select images for both wet and dry seasons to capture seasonal variations. (If necessary, otherwise use the date for the beginning of the dry season.). In our study area, the wet season is April-October and the dry season is November-March.
Apply filters for cloud cover (e.g., <10%) to ensure image clarity.
Collect in situ data for validation to identify features: wetland, farmlands, urban, tree, water body, grassland.
High-confidence interpreted data from high-resolution photography or ground-truth information gathered straight from the field are referred to as "in situ data." Every point or polygon has the appropriate land cover class (such as "wetland, water, urban, etc.") labeled on it. In situ data can be loaded as an asset, shapefile, or fusion table. When training a supervised classification algorithm such as Random Forest or SVM in GEE, you use in situ data as labeled samples (features with geometry + land cover class). Following classification, the model's accuracy in recognizing each class—for example, wetlands vs. farmlands—is evaluated using a different subset of the in situ data, known as the test set.
3. Prepossessing
Cloud Masking: Use built-in cloud masking functions (e.g., QA_PIXEL) to remove clouds.
The built-in cloud masking functions like QA_PIXEL are part of satellite image datasets in Google Earth Engine (GEE). Example: Cloud mask band: QA_PIXEL Collection: 'LANDSAT/LC08/C02/T1_L2'
Composite Creation: Generate median composites for each year or season to reduce noise.
Image Clipping: Clip all images to the defined study area for consistency.
Preprocessing of in situ data (if they lie outside of the area of interest)?
To compensate for the not enough in-situ validation points within the Area of interest (AOI), we adopted a spectral similarity analysis approach. This involved extracting the multiband spectral signatures (e.g., from Landsat imagery) of known land cover types from reference points situated around and within the AOI. These signatures will then search for spectrally similar pixels within the AOI
By computing spectral distances (e.g., Euclidean distance) between each AOI pixel and the reference signatures, we identified and mapped areas with high spectral similarity. These areas are considered likely to represent the same land cover types as the reference points and serve as proxy validation regions for assessing the classification output.
4. Feature Extraction
Compute relevant spectral indices to enhance wetland detection:
NDWI (Normalized Difference Water Index)—highlights surface water.
MNDWI (Modified NDWI) – better distinguishes water in urban/vegetated areas.
In Google Earth Engine (GEE), supervised classification combined with spectral indices is an effective approach for wetland mapping. These indices help differentiate wetlands from other land cover types based on water content, vegetation, and soil moisture First, Landsat imagery is used to compute key indices such as NDWI (to highlight open water), MNDWI (to separate water from urban/vegetated areas), NDVI (to capture vegetation density), and SMI (to estimate soil moisture). These indices are added as input features. then labeled in situ data representing various land cover types (including wetlands) is used to train a classifier such as Random Forest. The trained model then classifies the image based on the spectral patterns of the indices, allowing for accurate identification and mapping of wetland areas across the landscape.
In summary
· NDWI and MNDWI separate water from land.
· NDVI identifies vegetated wetlands.
· SMI enhances soil water content, especially useful in seasonal wetlands
5. Classification for land-cover mapping
Land cover classification using satellite imagery involves identifying different surface types such as water, wetlands, vegetation, urban areas, and farmlands. In this analysis, the Random Forest algorithm is used because it handles large datasets, performs well with minimal tuning, and is robust to noise and unbalanced class sizes. Training samples are collected for each land cover type using visual interpretation of imagery. The classifier is trained using spectral bands like B3, B4, B5, and B6 (Green, Red, NIR, SWIR) , along with indices such as NDVI and NDWI. Once trained, the model is applied to classify the entire image into the defined land cover classes.
Land cover classification plays a crucial role in wetland mapping because it helps distinguish wetlands from other land cover types such as open water, vegetation, farmlands, and urban areas. Wetlands often share similar spectral characteristics with nearby features, so using classification allows for more accurate identification and delineation.
6. Accuracy Assessment
Collect validation samples or use known land cover points.
Use a confusion matrix to calculate accuracy metrics (e.g., overall accuracy, kappa coefficient).
Adjust classification parameters if accuracy is unsatisfactory.
7. Map Generation and Export
Generate classified wetland maps for each target year (1995, 2005, 2015, 2025) or desired epoch
Use GEE’s Export.image.to Drive to save maps as GeoTIFFs or other formats.
Optionally, create map visualizations with legends and coordinates for reporting.
Analyze Temporal Changes in Wetland Areas
8. Temporal and Spatial Analysis
Conduct change detection to observe wetland expansion or loss over time.
Use zonal statistics or pixel-based comparisons to quantify changes.
Compare seasonal images to distinguish between permanent and seasonal wetlands.
9. Reporting and Interpretation
Visualize results through maps, graphs, and time-series charts.
Integrate findings with contextual layers (e.g., soil, elevation) for deeper insights.
Prepare outputs suitable for scientific publication, policy briefs, or community engagement.
Results
Preliminary results
A first attempt to map wetland time series was performed by identifying surfacing water from the Landsat archive. The implemented method was a simple thresholding based on MNDWI. In the first round, a fixed threshold was used (0), and then dynamic thresholding was used.
One limitation is the low availability of Landsat scenes: the first images available are from 1999. The time series was thinner at the beginning (less than 10 scenes for the season, until 2003) and became thicker to the last years (more than 30 scenes, up to 60 in 2023).
Another challenge is the broader definition of wetlands, which goes beyond surfacing water bodies and includes specific vegetation adapted to live in saturated soil conditions, so the current method addresses only partially the wetland characterization.
To overcome the first limitation, we have no possibility from space because Landsat is the longest space mission available. For the second, we will explore the most suitable features to characterize these complex environments, such as phenological features from optical data and soil moisture from SAR data.
Impact of the solution
Accurate Monitoring of Wetlands
The space-based system will give accurate and up-to-date information on the location and extent of wetlands in North Central Nigeria. Satellite images and GIS tools make it easier to track changes in wetland areas over time. This is especially significant in recognizing regions where wetlands are diminishing or disappearing as a result of climate change or human activities.
Informed Decision-Making
By analyzing the patterns and causes of wetland loss, the solution will assist policymakers and environmental managers in making educated decisions. It will help to design focused conservation policies, such as safeguarding vulnerable areas, regulating land use, and directing ecological restoration activities. The data collected will be used as scientific proof for environmental planning and sustainable development.
Community Awareness and Engagement
In addition, the solution will assist in raising awareness among communities and stakeholders by offering visual maps and simple insights. These tools can help the public understand the importance of wetlands and inspire community involvement in their protection.
Support for Biodiversity and Climate Resilience
Over time, this method will help to conserve biodiversity, minimize flood risk, and improve the region's ability to adapt to climate change. Wetlands serve an important role in preserving ecological balance, and protecting them helps to ensure long-term environmental and socioeconomic stability.
Relevant publications
Abubakar, Muhammad Lawal, and Auwal Farouk Abdussalam. "Geospatial analysis of land use changes and wetland dynamics in Kaduna Metropolis, Kaduna, Nigeria." Science World Journal 19, no. 3 (2024): 687-696.
Lin, Qiaoying, and Shen Yu. "Losses of natural coastal wetlands by land conversion and ecological degradation in the urbanizing Chinese coast." Scientific reports 8, no. 1 (2018): 15046.
Leemhuis, Constanze, Frank Thonfeld, Kristian Näschen, Stefanie Steinbach, Javier Muro, Adrian Strauch, Ander López, Giuseppe Daconto, Ian Games, and Bernd Diekkrüger. 2017. "Sustainability in the Food-Water-Ecosystem Nexus: The Role of Land Use and Land Cover Change for Water Resources and Ecosystems in the Kilombero Wetland, Tanzania" Sustainability 9, no. 9: 1513. https://doi.org/10.3390/su9091513
Meusburger, Katrin. "Mapping spatio-temporal dynamics of the cover and management factor (C-factor) for grasslands in Switzerland." (2018).
To establish an integrated monitoring and decision-support system that uses Earth Observation data and machine learning to track the status of Lake Ol' Bolossat, enabling evidence-based conservation and sustainable development actions.
Requirements
Data
Below is a table showing the data requirements and sources.
Data source
Use case
Period
JRC GSW
Historical water extents
1984 - 2023
Sentinel-1 SAR
Water extent during cloud-cover seasons
2014 - present
Sentinel-2 2 MSI
Habitat classification, NDVI, MNDWI, NDBI
2015 - present
MODIS
NDVI/ET anomalies and drought indicators
2000 - present
Rainfall and climate (CHIRPS/ERA5)
Climate trend correlation with hydrological changes
1984 - present
Population/Human settlement (WorldPop, GHSL)
Land use pressure mapping
2000 - present
Field surveys and local NGO data
Validation and community-level observations
As available
Software
The analysis is being done using open-source platforms and software: Google Earth Engine and QGIS.
To access Google Earth Engine, one needs a Google account that will be linked to the platform link. If you are new to the platform, create an account, and you can start using it. If you already have an account, just sign in and be directed to the code editor. If you are new to the software, you can access the training manual here.
To access QGIS, you need to download it as it is a software, link. If you are new to the software, you can access the training manual here.
Physical
Establishment of Ground Monitoring Stations
Purpose: To validate satellite data and collect real-time, on-the-ground water level, rainfall, and biodiversity observations.
Components: Water gauges, weather sensors, camera traps for biodiversity, and simple soil moisture probes.
Community Information Boards or Digital Kiosks
Purpose: To display maps, water level trends, and habitat updates to residents in a simplified, accessible format.
Location: Strategic points around the lake (e.g., near schools, water collection points, community centers).
Buffer Zone Demarcation and Fencing
Purpose: To physically protect critical wetland habitats and prevent encroachment or grazing in sensitive areas.
Details: Fencing or natural barriers like vegetation planting along designated riparian zones.
Construction of a Local Conservation and Data Hub
Purpose: To provide a space for community meetings, training sessions, citizen science coordination, and storing field equipment.
Location: Ideally within a local government or NGO compound near the lake.
Rehabilitation of Degraded Wetlands
Purpose: Restore areas where the lakebed or surrounding wetlands have been severely altered.
Methods: Planting of indigenous wetland vegetation, removal of invasive species, and controlled re-wetting.
Water Resource Management Infrastructure
Purpose: To improve the regulation and sustainable use of the lake's water.
Examples: Controlled inflow/outflow channels, community-led irrigation management systems, water pans for livestock to reduce direct lake access.
Signage and Protected Area Boundary Markers
Purpose: To raise awareness of Lake Ol’ Bolossat’s legal protection status and to visually communicate boundaries to land users.
Materials: Durable signs, educational posters, and protected area plaques.
Solar-Powered Connectivity Units (Optional but strategic)
Purpose: For uplinking field sensor data or enabling access to the online dashboard in remote locations.
Components: Solar panels, GSM routers, rugged tablets or data loggers.
Outline steps for a solution
Phase 1: Planning and Stakeholder Engagement – To do
The first phase involves defining the objectives of the monitoring system and identifying measurable success indicators aligned with conservation priorities and local needs. This is followed by engaging key stakeholders such as the National Environment Management Authority (NEMA), Kenya Wildlife Service (KWS), Water Resources Authority (WRA), Nyandarua County Government, and local community-based organizations. Stakeholder consultations are critical for gathering input on data needs, identifying decision-making gaps, and ensuring buy-in from both policy actors and community leaders. A situational analysis should be conducted to map existing infrastructure, technical capacity, internet access, and human resources available on the ground, helping to identify opportunities and constraints for implementation.
Phase 2: Data Collection and System Design – In progress
In this phase, a comprehensive monitoring framework is developed, specifying the key indicators to be tracked, such as seasonal water extent, land cover transitions, and flood-prone zones. Relevant Earth observation datasets are selected, including Sentinel-1 SAR for water extent, Sentinel-2 for habitat classification, JRC Global Surface Water for historical trends, and CHIRPS for rainfall data. A prototype dashboard is developed using Google Earth Engine, visualizing these datasets through maps, time series graphs, and interactive overlays. Simultaneously, field validation activities are conducted to ground-truth satellite-derived maps. This includes collecting GPS points, photos, and observations on vegetation, land use, and visible signs of degradation, ensuring the remote sensing outputs are accurate and contextually relevant.
Phase 3: System Testing and Expansion – To do
Once the prototype is ready, it is tested with stakeholders through pilot sessions and community workshops. These engagements are used to collect feedback on the dashboard’s usability, relevance, and user experience, particularly for non-technical audiences. Revisions are made to improve clarity, layer toggling, labelling, and interpretability. In parallel, basic physical interventions begin, such as the installation of simple water gauges, informational signboards, and boundary markers for conservation zones. These elements help translate digital insights into tangible tools for the community. Plans for expanding field infrastructure, such as creating buffer zones or establishing a local conservation hub, are also explored during this phase.
Phase 4: Deployment and Knowledge Sharing – In progress
Following successful pilot testing and system refinement, the full monitoring platform is deployed on a publicly accessible hosting environment, such as Firebase, Earth Engine Apps, or a custom-built website. The platform is shared with agencies and conservation partners, accompanied by a rollout plan that includes formal training sessions. These capacity-building workshops are designed to empower users, ranging from government officers to youth groups, with the skills to interpret dashboard outputs and use the data in planning and response. User guides, translated materials, and offline summaries are provided to support long-term usability and local ownership.
Phase 5: Monitoring, Maintenance, and Scaling – To do
The final phase focuses on monitoring the performance and real-world impact of the system. Regular evaluations are conducted to assess usage, data accuracy, stakeholder engagement, and improvements in environmental decision-making. Lessons learned are used to refine system features, add new datasets, and introduce functionalities such as alert notifications or mobile-friendly access. The success of the Lake Ol’ Bolossat solution creates a foundation for scaling to other endangered wetlands across Kenya, such as Lakes Baringo, Naivasha, or Kanyaboli. Finally, the project contributes to the broader Space4Water and open science communities by publishing methods, code, and findings on platforms like GitHub and Earth Engine’s asset repository, ensuring transparency, replicability, and collaboration.
Results
The Lake Ol’ Bolossat monitoring system, currently at prototype stage, holds significant potential to transform how freshwater ecosystems are managed at local and national levels. By integrating satellite-derived water and habitat data into an accessible dashboard, the system aims to bridge the gap between Earth observation science and on-the-ground conservation action. Once implemented with key stakeholders and end users, the following impacts are anticipated:
Support for Environmental Agencies and County Governments: The system could enhance the capacity of institutions such as the National Environment Management Authority (NEMA), Kenya Wildlife Service (KWS), Water Resources Authority (WRA), and the Nyandarua County Government by providing timely, location-specific data for decision-making on lake and wetland management.
Early Warning for Hydrological and Ecological Risks: The dashboard could enable stakeholders to detect abnormal patterns in water extent, such as persistent shrinkage or sudden expansion, triggering early intervention to prevent ecological degradation or disaster impacts on nearby communities.
Community Awareness and Engagement: By visualizing seasonal and long-term changes, the system can be used to build awareness among residents, farmers, and water users around Lake Ol’ Bolossat, empowering them to engage in sustainable practices and to advocate for the protection of the lake.
Policy-Relevant Monitoring Tool: The platform can serve as a long-term environmental monitoring tool to support the implementation of wetland protection policies, local water catchment strategies, and integrated land use planning frameworks.
Scalability to Other Freshwater Ecosystems: Once validated, the approach used at Lake Ol’ Bolossat can be adapted to other small inland water bodies across Kenya and East Africa, particularly those facing similar risks of drying, encroachment, or biodiversity loss.
Alignment with Global and National Development Goals: The system supports Kenya’s contributions to Sustainable Development Goals (SDGs), particularly:
SDG 6: Ensure availability and sustainable management of water and sanitation
SDG 13: Take urgent action to combat climate change and its impacts
SDG 15: Protect, restore and promote sustainable use of terrestrial ecosystems and halt biodiversity loss