

Introduction
The frequency and severity of extreme climate events are on the rise, driven by the impacts of climate change. Since the latter half of the nineteenth century, extreme weather events have steadily become more normal. These changes in extreme weather patterns contribute to the growing incidence of climate-related natural disasters like droughts and floods (Yisehak & Zenebe, 2021). Climate change also alters streamflow patterns, potentially leading to more severe flood events. Extreme precipitation events play a significant role in triggering natural disasters. Consequently, the increasing frequency and duration of intense extreme rainfall events, including landslides, floods and water scarcity after rain-on-snow events, will likely contribute to a rising number of hydro-meteorological disasters (Clifton et al., 2018; Zisopoulou & Panagoulia, 2021).
According to reports from the Intergovernmental Panel on Climate Change (IPCC), climate change has induced hydrological changes worldwide in recent years, heightening the likelihood of extreme weather events. Hydrological extremes are intrinsic features of the climate and can occur in virtually all climatic regions, irrespective of their historical precipitation levels. Given that human societies, ecosystems and physical infrastructure have adapted to prevailing climatic conditions, they often lack the resilience to withstand extreme climatic events. Consequently, deviations can have adverse impacts on ecosystems and communities, resulting in substantial economic and social impacts. Kenya, as a country located in tropical climate, faces recurring floods (Douglas, 2017). The Kwale county as one of coastal regions in Kenya is particularly vulnerable, with substantial damage and displacement of population (Ojwang et al., 2017). This study identified flood-prone areas within the basin, emphasizing the crucial role of flood assessment mitigation. It aligns with global flood mitigation efforts using geographic information systems (GIS), Earth observation (EO) and multi-criteria decision-making (MCDM), specifically analytic hierarchy process (AHP). Despite the evident risks, Kwale County still lacks a comprehensive and community-engaged flood risk assessment. As a result, the community is left unprepared to deal with these escalating threats (Ruto et al., 2010).
In recent years, various methodological approaches have emerged to assess risks. These include statistical and mathematical methods, remote sensing and GIS techniques, and a combination of methods such as GIS-modelling-simulation. Given its multidisciplinary character, multi-criteria decision analysis (MCDA) has emerged as a widely used approach for tackling such issues. The MCDM technique is applicable in different domains and fields such as:
- water resources and energy management;
- agriculture, land use, forestry and construction;
- recycling management; and
- policy planning and sustainability.
In this context, MCDA provides methodologies to facilitate decision-making in situations, where numerous conflicting criteria are involved.
Methodology
Earth observation in flood risk assessment
Renowned experts worldwide have emphasised the significance of cost and time-effective decision-making strategies based on GIS techniques for flood mapping. The role of geospatial technologies, encompassing EO and GIS, has marked a significant advancement in flood forecasting, modelling and hazard assessment.
EO plays a pivotal role in acquiring critical data for mapping flood inundation, while the power of GIS comes to the forefront in effective flood risk management (Wang & Xie, 2018). The precise mapping and management of flood risk are of paramount importance, necessitating the use of state-of-the-art technologies like EO, GIS and geo-statistics. EO provides a cost-effective and time-efficient means of data acquisition, serving as a valuable alternative or supplement to on-site data collection for building essential databases in hazard management. Crucially, the integration of in-situ data remains indispensable for tasks such as calibration, validation, and providing detailed ground truth information. On the other hand, GIS provides a comprehensive toolkit for flood risk management, including the identification of flood-prone areas, vulnerability mapping and the setup of hydrologic models.
Description of the study area
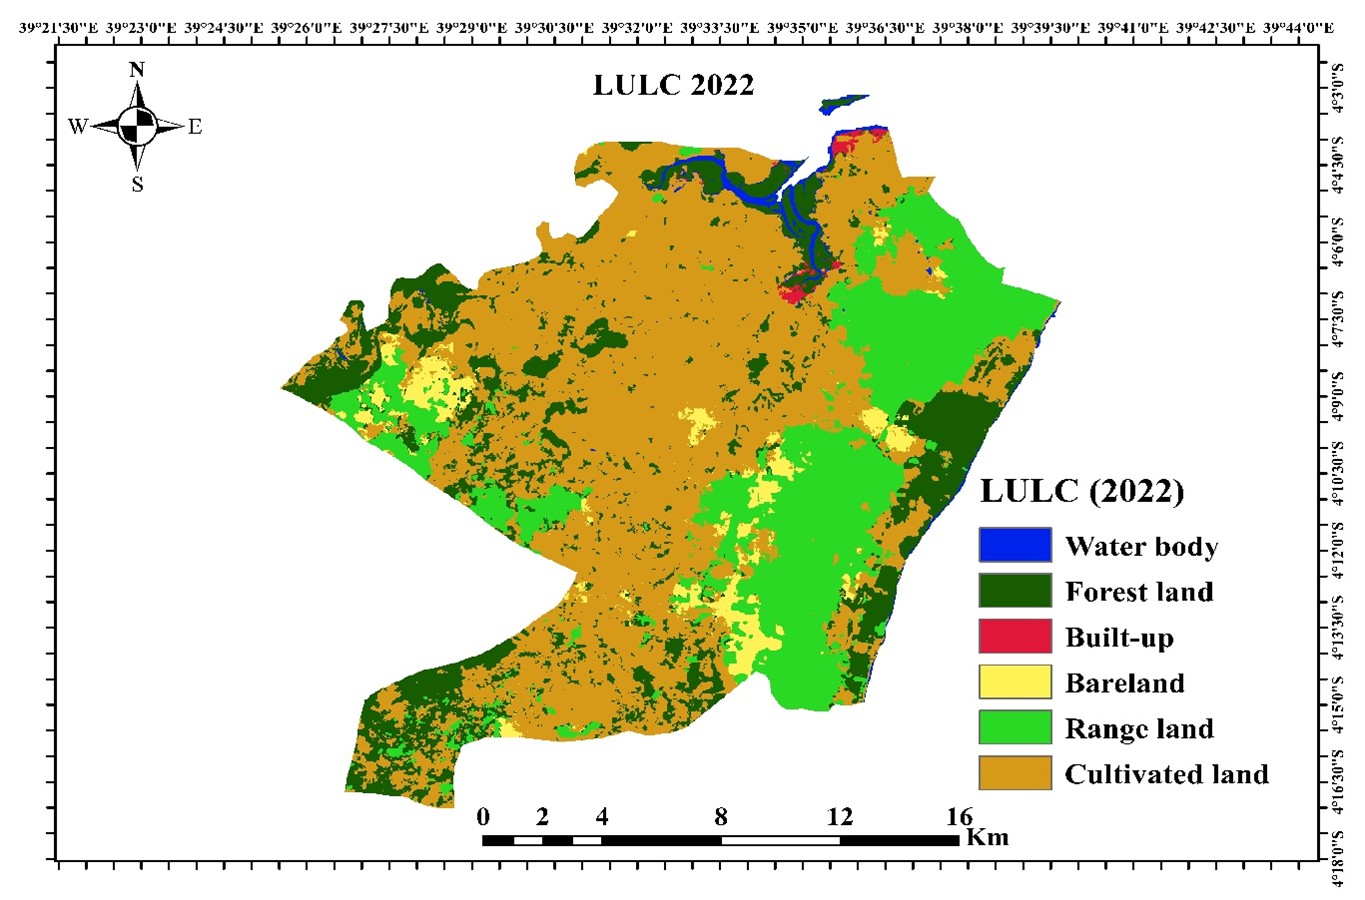
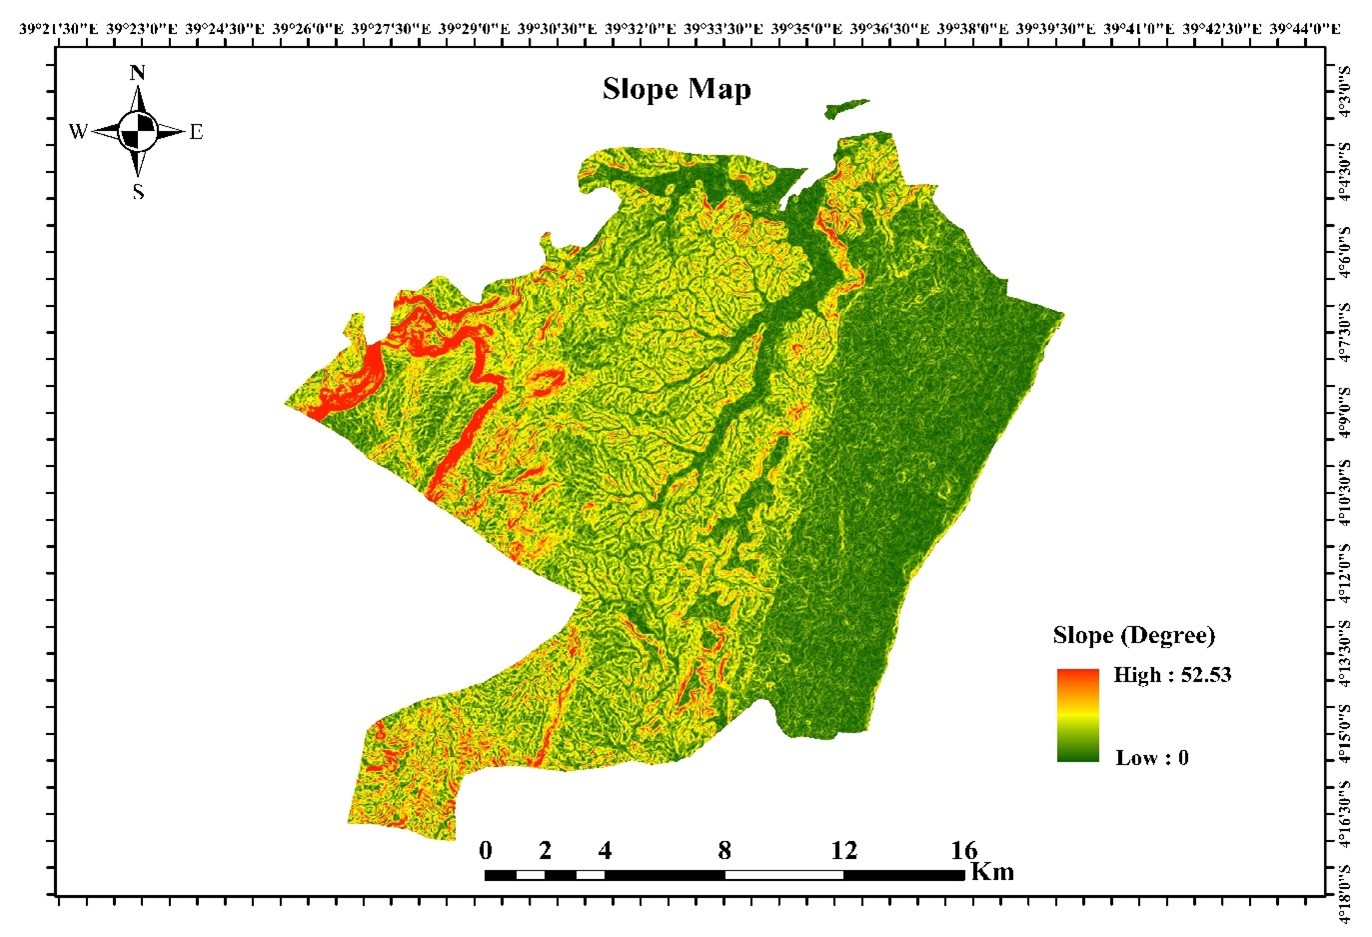
Matuga, located in the Kwale County of Kenya, lies between latitudes 4°3′S and 4°17′S and longitudes 39°25′E and 39°43′E (Figure 1). This region is characterised by diverse topographical and ecological features, including rolling hills, plains and coastal areas. The slope gradient in the region varies significantly between 0° and 52.53°, with steeper slopes found predominantly in the elevated areas, contributing to varied surface runoff dynamics and erosion potential (Figure 3c). According to the 2022 Land Use Land Cover (LULC) map, the area is predominantly categorized as cultivated land, forest land and range land with smaller proportions of built-up areas and water bodies (Figure 3a). The distribution of cultivated land in the study area illustrates how prevalent agricultural practices are.
Methods
Data sources and collection process
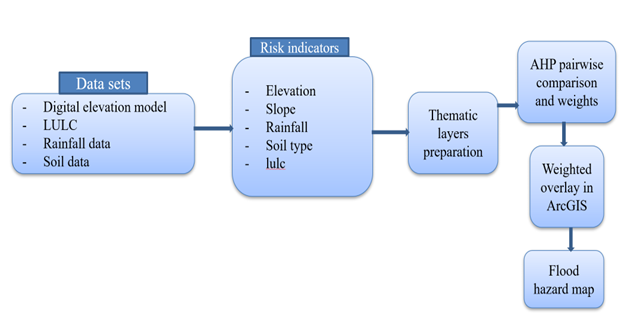
Digital secondary data sets such as elevation, rainfall, slope and soil type were collected from the relevant organizations to carry out this research work (Table 1). The soil map was obtained from the Directorate of Resource Surveys and Remote Sensing (DRSRS), Nairobi, Kenya in a vector format. Then the vector format was later clipped to the area of interest (AOI) and converted to raster map using polygon to raster of conversion tool in ArcGIS 10.8 environment. .The Living Atlas provided the Esri Land Cover 2022 dataset, which was then processed to create Matuga LULC map (Figure 3). With a 10 m resolution, this open-source dataset depicts a nine-class worldwide LULC map for 2022 that was produced using Esri Sentinel-2 Land Cover Explorer. The Shuttle Radar Topographic Mission (SRTM) Digital Elevation Model (DEM) with 30 by 30 m spatial resolution was sourced from the United States Geological Survey (USGS). It was used to delineate the elevation and slope map of the study area. Rainfall data for 22 years (2000-2022) was acquired from the National Aeronautics and Space Administration (NASA) POWER Project.
| Data | Resolution | Source |
|---|---|---|
| DEM | 30 m | USGS Earth Explorer |
| Soil | Vector (resampled to 30 m) | The Directorate of Resource Surveys and Remote Sensing (DRSRS), Nairobi, Kenya |
| Rainfall | 10 km (resampled to 30 m) | NASA Power Project |
| LULC | 10 m (resampled to 30 m) | Esri Sentinel-2 Land Cover Explorer |
Data processing
According to Mishra & Sinha (2020), flood hazard signifies the likelihood of flood events occurring in a specific area, determined by the geomorphological and hydrological variables of the region. For the research at hand, the author purposely selected flood-indicative parameters based on hydrological and geomorphological attributes, namely soil type, land use land cover, rainfall, elevation and slope. All parameters were reclassified into five flood susceptibility classes: very high, high, moderate, low and very low. In this process, digital spatial layers were generated for each thematic layer using ArcGIS. The overall analysis was conducted using the AHP Excel Version 2022.07.08 and ArcGIS 10.8.
Analytical Hierarchy Process
AHP was used in this work to estimate the weights for each input variable in the flood risk mapping. This study used multi-objective decision analysis (MODA) developed by Saaty (1977), which utilises a pair-wise comparison approach, constructing a judgment matrix with absolute numbers on a scale from 1 to 9 to evaluate the relative significance among criteria, where 1 signifies equal importance, and 9 indicates significantly greater importance (Table 2). It was discovered that the pairwise comparison matrix was crucial in determining these weight values. The AHP methodology involves several key phases(T. Saaty & Vargas, 2012):
- choosing the multi-criteria parameters;
- organizing the parameters in a hierarchical fashion;
- determining the relative relevance by giving each parameter a subjective value; and
- combining the ratings to determine priorities (Saaty & Vargas, 2012).
The procedures mentioned in the flowchart in Figure 2 were implemented to generate the flood risk map of Matuga (see Figure 7). The determination of pairwise comparative weights has a high dependence on expert opinion (researcher) and needs to meet the consistency ratio (CR) requirements. Weights allocated to each parameter were normalized using the eigenvector and the eigenvector was then put through a consistency check.
| Intensity of importance on an absolute scale | Definition | Explanation |
|---|---|---|
| 1 | Equal importance | Two activities contribute to the objective |
| 3 | Moderate importance of one over another | Experience and judgment strongly favor one activity over another |
| 5 | Essential or strong importance | Experience and judgment strongly favor one activity over another |
| 7 | Very strong importance | An activity is strongly favored and its dominance demonstrated in practice |
| 9 | Extreme importance | The evidence favoring one activity over another is of tile highest possible order of affirmation |
| 2, 4, 6, 8 | Intermediate values between the two adjacent judgments | When compromise is needed |
Flood zone identification
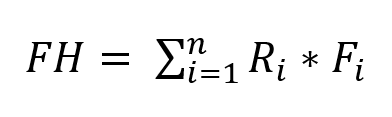
The selected flood influencing factors: soil type, land use land cover, slope, rainfall and elevation were converted into raster format and reclassified, meaning that their continuous and/or categorical values were grouped into defined classes or ranges based on their relative contribution to flood susceptibility, allowing for standardized comparison and analysis across all factors (Table 3). Subsequently, they were assigned weights obtained from the AHP (Equation 1) in the ArcGIS environment to produce a flood hazard map for the Matuga state.
Results and discussion
Flooding factors and their relative weights
Given the regional heterogeneity in flood causes, using a variety of flood conditioning factors is helpful in evaluating how well flood risk management is working in flood-prone locations. This study used AHP which considers both subjective and objective factors to choose the finest alternatives. For pairwise comparison and calculation of the weights, the research employed AHP Excel Version 2022.07.08 developed by Goepel (2013). A pairwise comparison matrix was developed to define the appropriate weight signifying the influence of every factor that affects flooding. In this matrix for pairwise comparisons, the significance of every factor is determined by evaluating each factor against every other using a comparative scale introduced by Saaty (1980), which spans from 1 to 9.
The results of flood influencing factor analysis in the study area showed the following weightings: rainfall (22 per cent), elevation (21 per cent), slope (21 per cent), LULC (21 per cent) and soil type (17 per cent) (Table 3). This suggests that rainfall contributes more than other elements to flooding events in Matuga. In line with this study, Animashaun et al. (2024), in their GIS-based Analytical Hierarchy Process (AHP) study of the Niger South District in Nigeria, identified rainfall distribution as the most influential factor in flood occurrence, assigning it the highest weight of 0.39 (39 per cent) among all six considered variables. This strong weighting highlights the dominant role of precipitation intensity and distribution in generating flood events in the region, especially where natural drainage and urban infrastructure are poorly developed.
| Flood causative criterion | Unit | Class | Hazard class range | Hazard range | Weight (percentage) |
|---|---|---|---|---|---|
| LULC | level | Water body | Very high | 5 | 19 |
| Forest land | Low | 2 | |||
| Built-up | Moderate | 3 | |||
| Bare land | High | 4 | |||
| Range land | Very low | 1 | |||
| Cultivated land | High | 3 | |||
| Soil type | level | Ferralic Arenosols | Very low | 1 | 17 |
| Dystric Arenosols | |||||
| Chromic Luvisol | Low | 2 | |||
| Lithosol | |||||
| Chromic Cambisols | Moderate | 3 | |||
| Humic Nitosols | |||||
| Humic Ferralsols | |||||
| Haplic Phaeozems | High | 4 | |||
| Eutric Planosols | |||||
| Vertic Luvisols | Very high | 5 | |||
| Mollic Gleysols | |||||
| Rainfall | mm | 15.81 - 15.85 | Very low | 1 | 22 |
| 15.85 - 15.89 | Low | 2 | |||
| 15.89 - 15.94 | Moderate | 3 | |||
| 15.94 - 15.98 | High | 4 | |||
| 15.98 - 16.02 | Very high | 5 | |||
| Elevation | m | -11 - 48 | Very low | 1 | 21 |
| 48 - 101 | Low | 2 | |||
| 101 - 173 | Moderate | 3 | |||
| 173 - 283 | High | 4 | |||
| 283 - 438 | Very high | 5 | |||
| Slope | degree | 0 - 3.296 | Very low | 1 | 21 |
| 3.296 - 6.592 | Low | 2 | |||
| 6.592 - 11.124 | Moderate | 3 | |||
| 11.124 - 19.158 | High | 4 | |||
| 19.158 - 52.531 | Very high | 5 |
The results present valuable insights into the spatial variability of flood-indicating parameters within the study area (Figure 3-6). The LULC map highlights the distribution of various land-use types, including water bodies, forests, built-up areas, bare land, rangeland and cultivated land (Figure 3). Built-up areas, concentrated in specific zones, are likely to experience higher surface runoff due to the impervious nature of urban surfaces (Du et al., 2015; Xu et al., 2020).
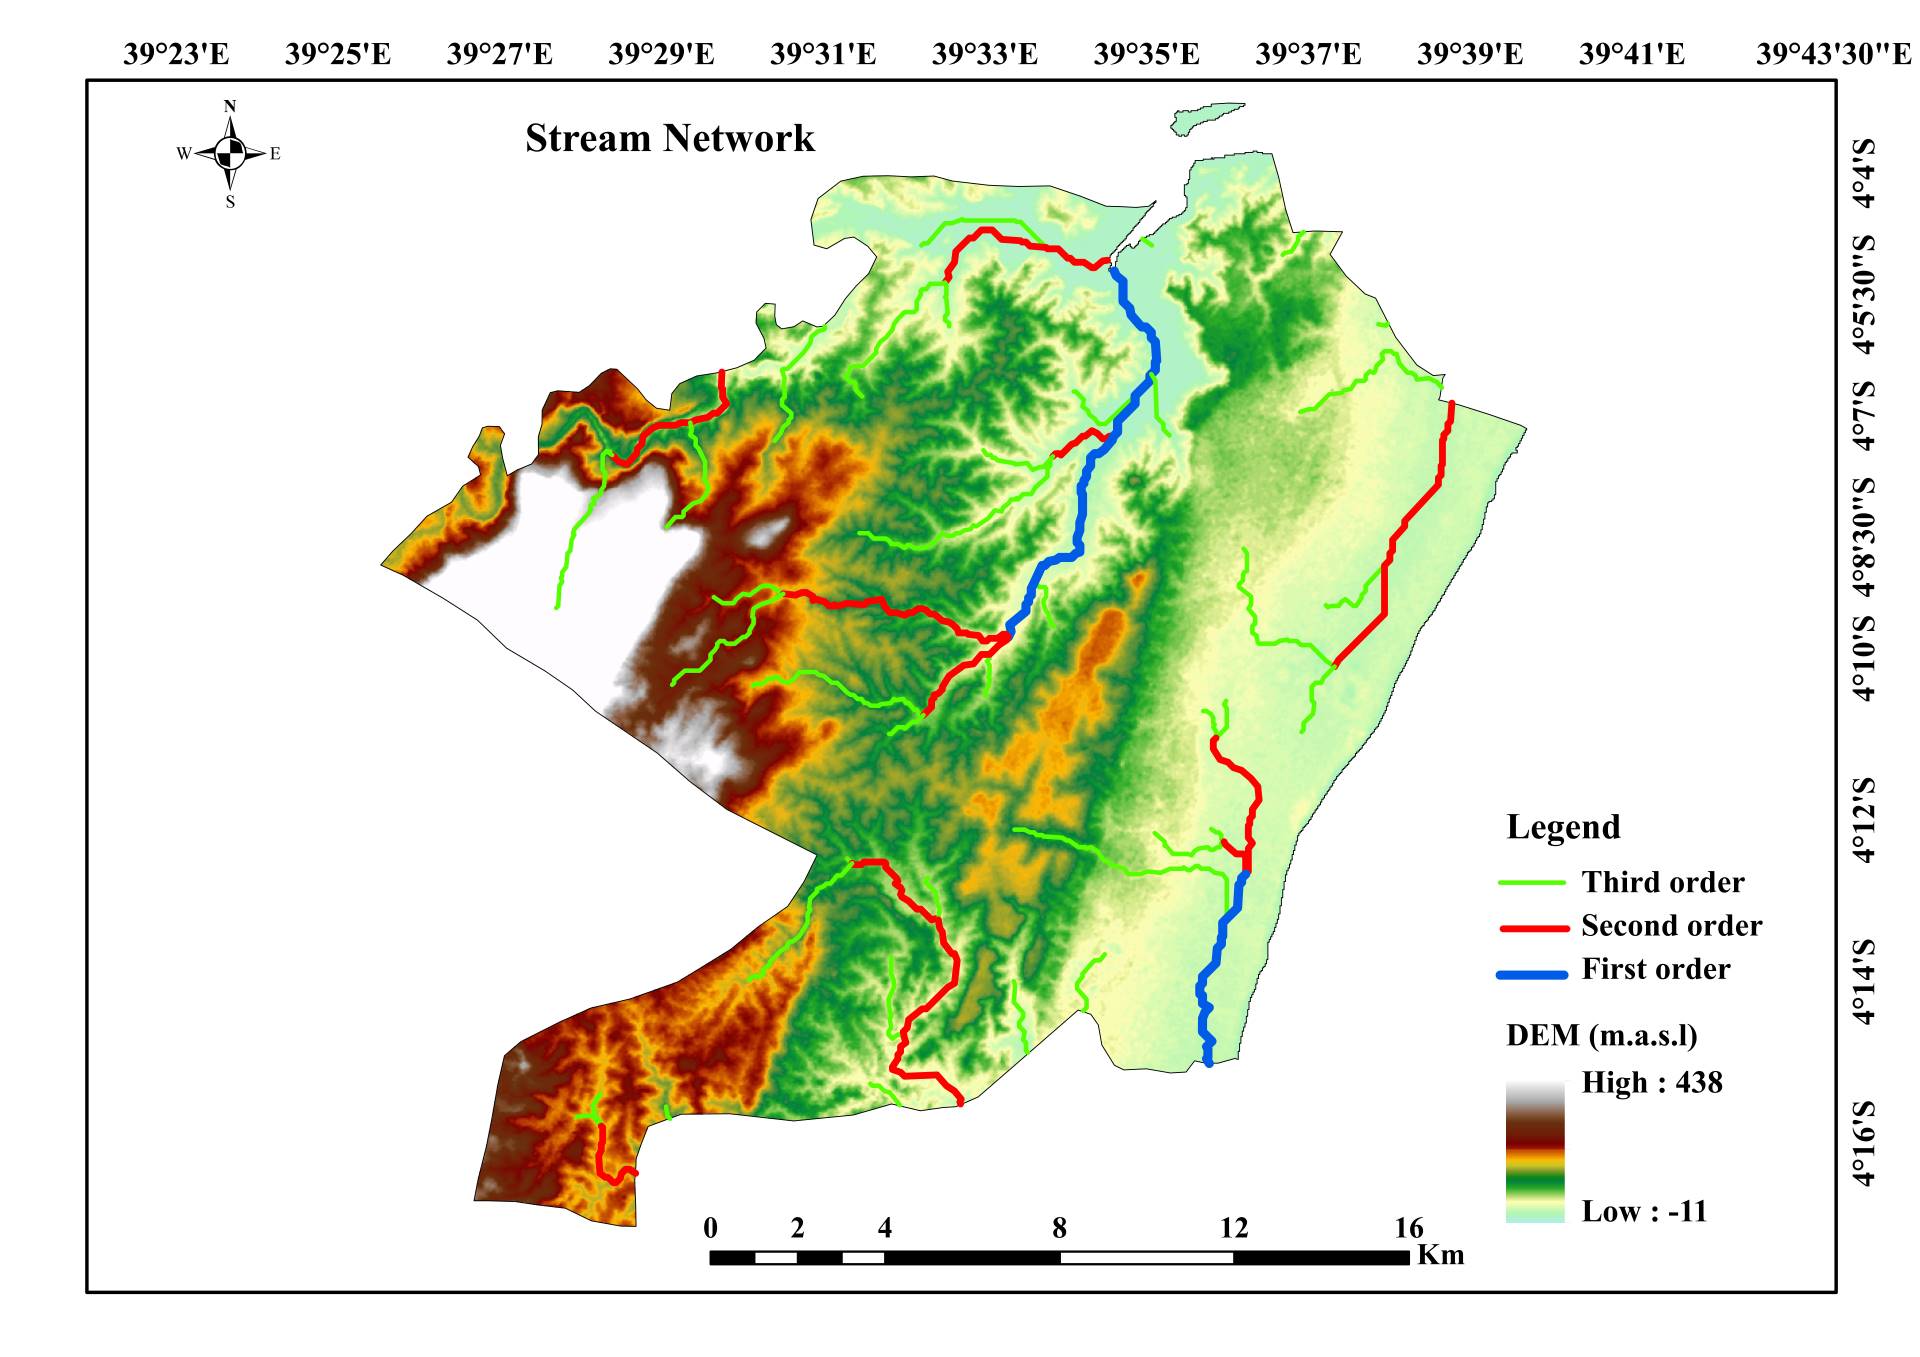
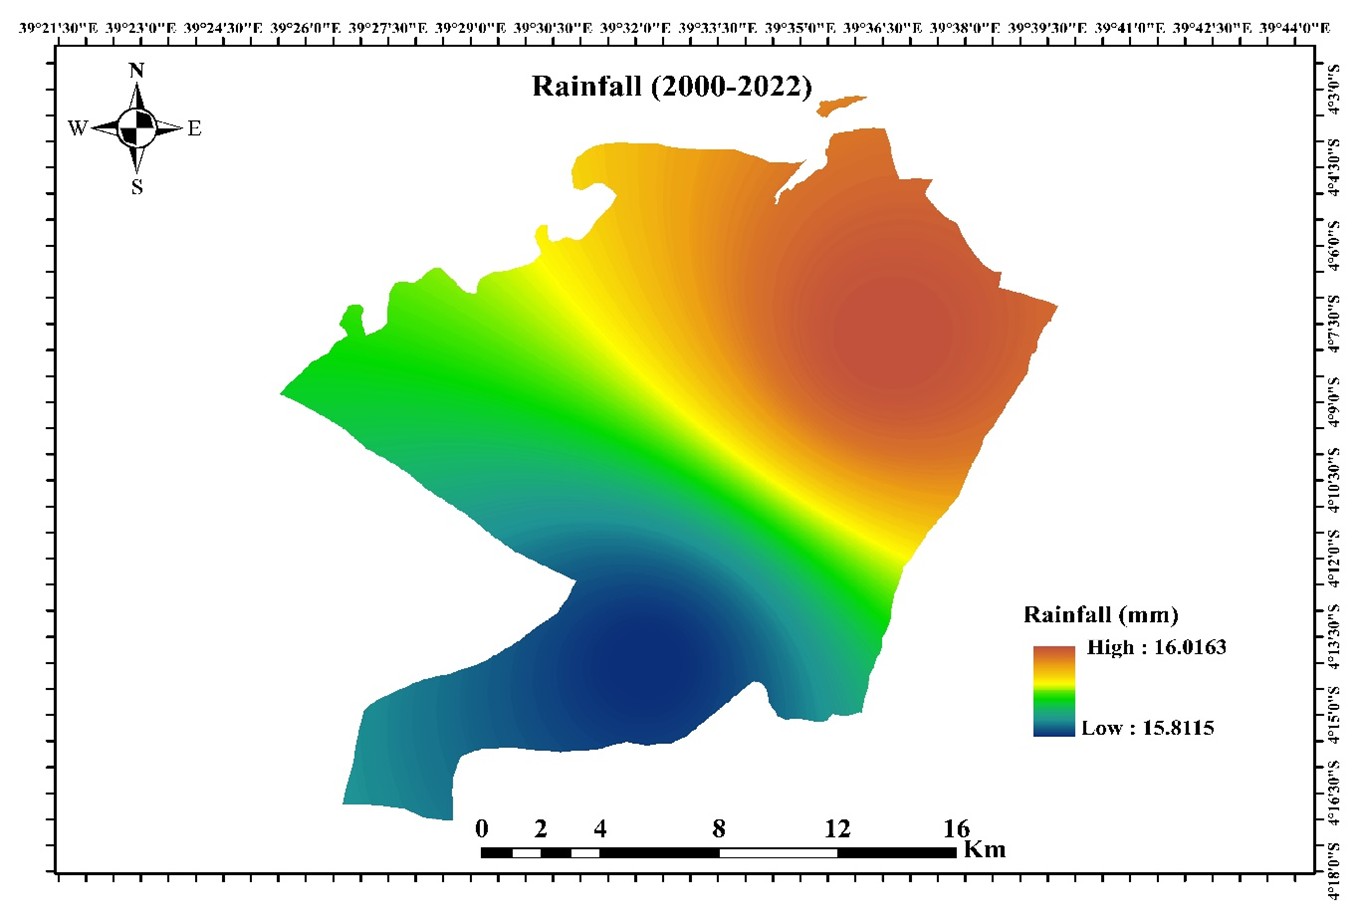
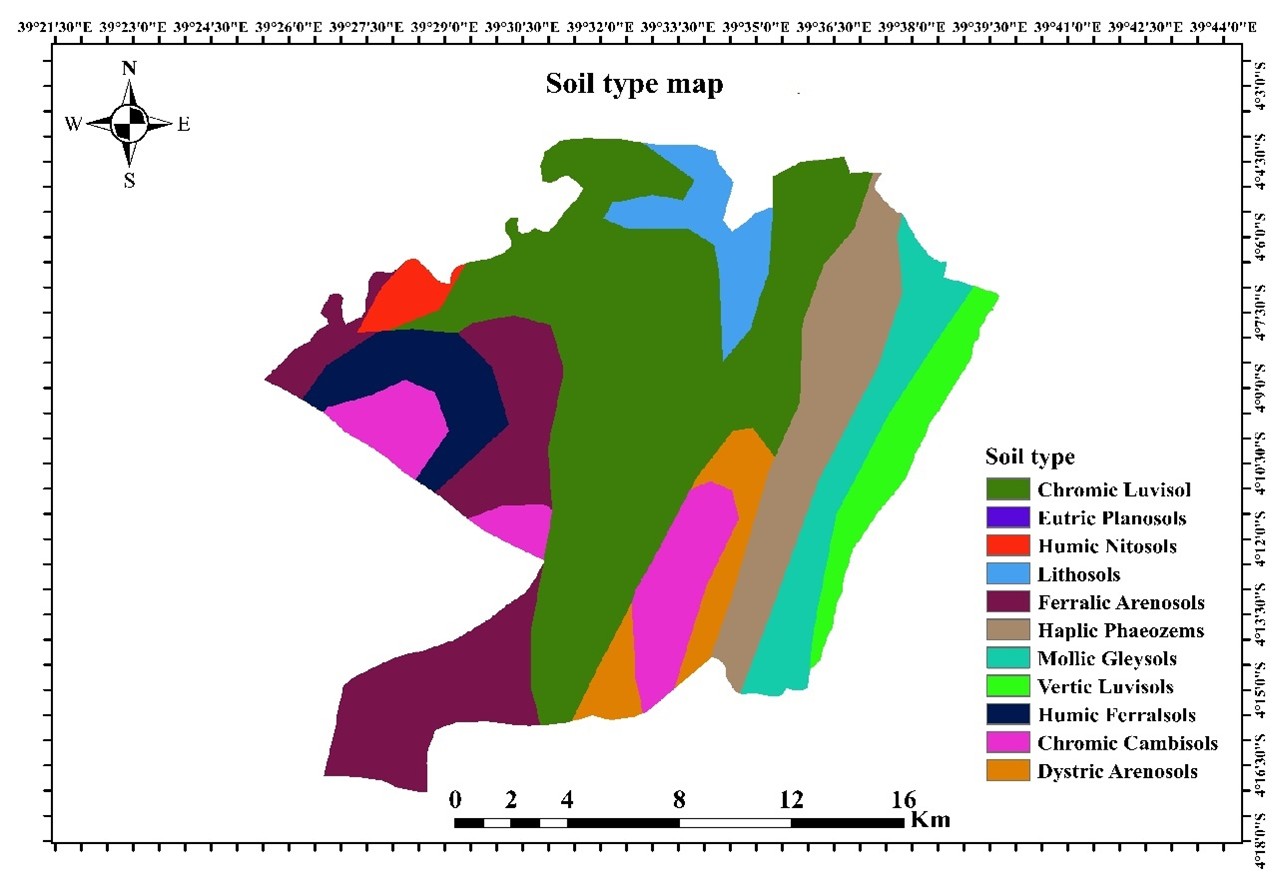
The elevation map reveals that the study area ranges from -11 m (low-lying regions) to 438 m (high-altitude regions) (Figure 1). The slope map shows that the steepest slopes, reaching up to 52.53°, are predominantly located in the hilly and elevated areas of the region, while flatter areas are mainly found in the floodplain (Figure 5). The steep slopes contribute to rapid surface runoff, increasing water velocity and erosion potential, which can exacerbate flooding (Barrocu & Eslamian, 2022; Kanito et al., 2023). Consistent with these findings, this finding also highlights the significant role of steep slopes in intensifying flood risks, particularly in southern and western areas of Matuga. The rainfall map shows spatial variability, with precipitation levels ranging between 15.81 mm and 16.02 mm (Figure 4). Although the rainfall variability is relatively small across the region, the map underscores the combination of higher precipitation in certain areas. Other factors, such as steep slope, cultivated land and bare land, could exacerbate flood generation in these zones. Finally, the soil type map highlights a diverse distribution of soil classes, including Ferralic Arenosols, Dystric Arenosols, Chromic Luvisols, Vertic Luvisols and others (Figure 6). The integration of these parameters demonstrates a comprehensive spatial variability in flood risk across the study area.
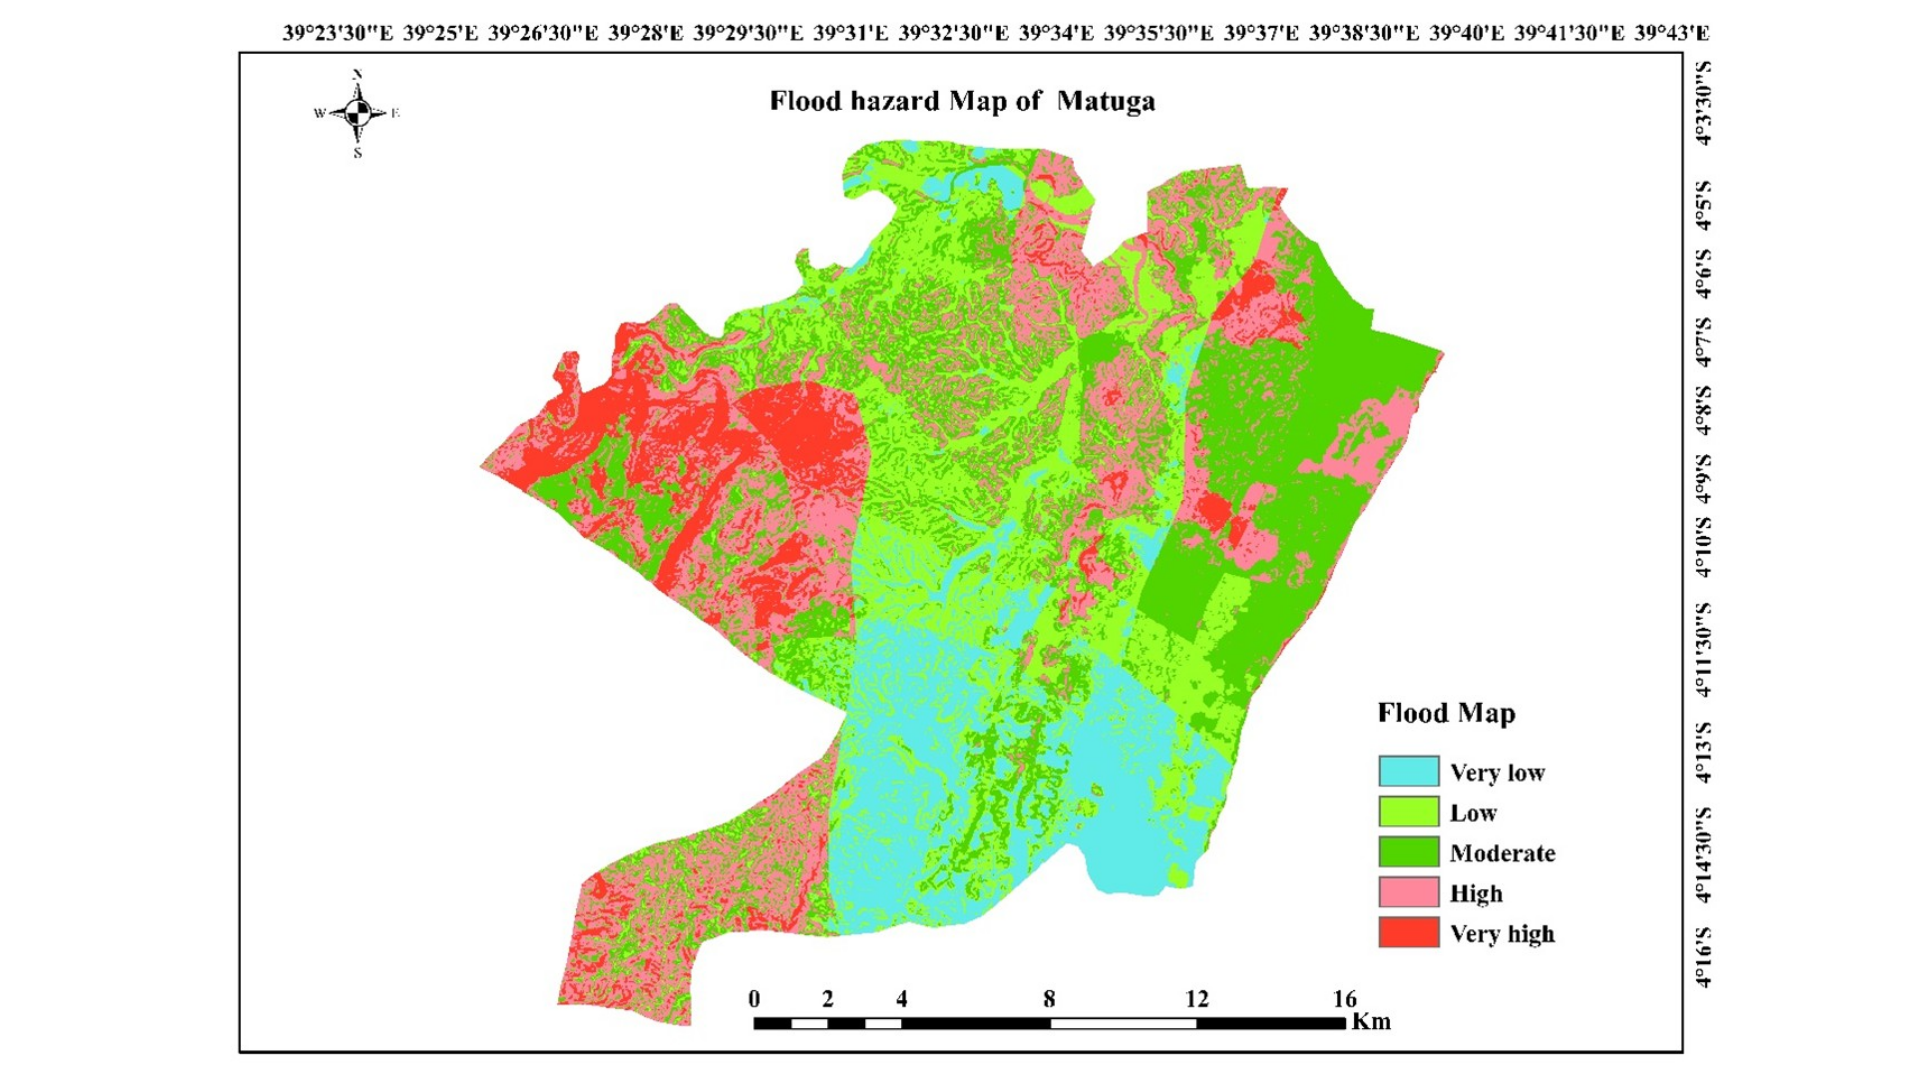
Flood risk result
The flood hazard map of Matuga demonstrates a clear spatial variation in flood risk across the study area, categorized into very low, low, moderate, high and very high-risk zones with notable variations across the study area (Figure 7). Susceptibility aligns with the interplay of multiple contributing factors, including bare lands, elevation, built-up areas and slope, which are characterized by reduced infiltration capacity and high surface runoff (Rahman et al., 2023). The southern, western and northern parts of the study area exhibit a mix of high to very high flood-risk zones, particularly in regions characterized by steep terrain, high rainfall intensity and proximity to river bodies. The convergence of these factors results in accelerated water flow, significantly increasing the vulnerability of these areas to flooding events. The presence of rivers and water bodies further exacerbates flood risks, as they act as natural conduits for water flow, leading to overflow and inundation during heavy rainfall events (Ologunorisa et al., 2022). Additionally, land use practices in these zones, such as bare land, built-up areas and agricultural activities, further exacerbate their susceptibility to flooding.
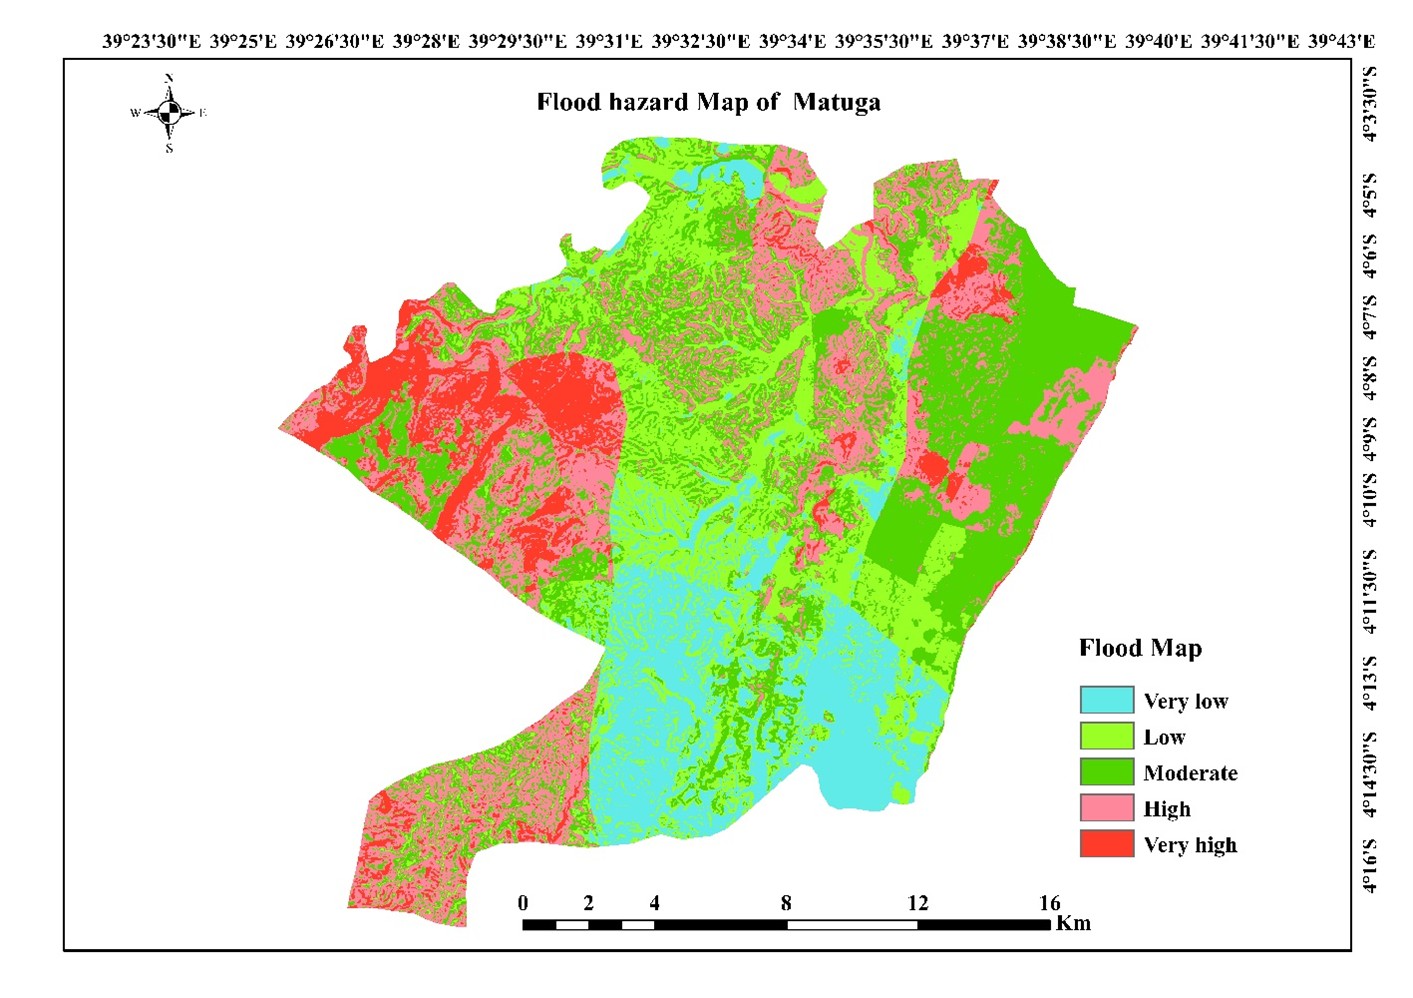
Moderate flood risk zones are predominantly located in the eastern part of the study area and are sparsely distributed across other regions. In contrast, the northern part exhibits localised zones of high flood risk, primarily due to their proximity to rivers and higher rainfall intensity. These high-risk zones are often associated with micro-topographic depressions, which act as natural water collection points, further exacerbating the likelihood of flooding. The findings in this study are comparable to those of Safaei-Moghadam et al. (2023), who noted that flood risk hotspots often emerge in regions with micro-topographic depressions. The soil composition in the middle part of the study area is predominantly characterised by Chromic Cambisols and Chromic Luvisols, which provide moderate infiltration capacity. Additionally, the mixed LULC in this region, comprising rangeland and scattered forests, contributes to some degree of flood mitigation by enhancing surface roughness and promoting water retention. However, these natural measures must be reinforced by integrated flood risk management strategies to fully counteract flooding vulnerability during extreme weather events. Structural measures, such as the construction of retention ponds, check dams and improved drainage systems, can help reduce flood peaks (Sayers et al., 2013). Additionally, afforestation and reforestation initiatives can enhance water infiltration and reduce soil erosion, particularly in areas with scattered forests (Lasanta et al., 2019). Non-structural measures such as community-based approaches, including early warning systems and flood preparedness programs, can further enhance resilience and reduce the socio-economic impacts of flooding. Combining these strategies with sustainable agricultural practices, such as contour farming and agroforestry, can improve soil structure and water retention capacity, thereby reducing runoff (La et al., 2023).
The low and very low flood risk zones are primarily situated in the southwest and centre of Matuga. The presence of Ferralic Arenosols and Dystric Arenosols in these zones allows for rapid water infiltration and reduces flood risk. The low slope and extensive shrub cover in these sections act as a natural barrier, stabilising the soil and significantly mitigating the effects of rainfall. This combination ensured minimal flood susceptibility in these areas. The results align with previous studies, which highlight the role of vegetation and topography in controlling flood hazards (Ali et al., 2021; Dung et al., 2022).
This research in spatial delineation of flood risks in coastal areas of Kenya provides critical insights for prioritising intervention measures, ensuring sustainable land management and enhancing community resilience to flooding events. By identifying high-risk zones, such as areas with steep slopes, poor drainage and poor land cover, decision-makers can target resources more effectively to mitigate flood impacts. For instance, structural interventions like retention basins, improved drainage systems and flood barriers can be prioritised in high-risk areas, while low-risk zones can focus on preventive measures, such as afforestation and soil conservation. Additionally, integrating these findings into land-use planning and zoning regulations can help reduce future vulnerability by restricting high-density development in flood-prone areas. Community engagement and education programs can further enhance local preparedness and adaptive capacity, ensuring that resilience-building efforts are inclusive and sustainable. Ultimately, this spatially explicit approach not only supports evidence-based flood risk management but also aligns with key UN initiatives, including the Sendai Framework for Disaster Risk Reduction 2015-2030 and the Sustainable Development Goals (SDGs), specifically SDG 11 (Sustainable Cities and Communities) and SDG 13 (Climate Action). By providing a detailed, location-specific understanding of flood risk, the approach directly contributes to understanding disaster risk (Sendai Priority 1), supports reducing the number of people affected by disasters (SDG 11.5), and strengthens resilience to climate-related hazards (SDG 13.1).
Conclusion
This study delineated flood risk zones in the study area by using five influencing factors, such as rainfall intensity (22 per cent), elevation (21 per cent), slope (21 per cent), LULC (21 per cent), and soil type (17 per cent). The analysis revealed that the southern, western, and northern parts of the region are particularly vulnerable to flooding due to steep slopes, high rainfall, and proximity to rivers bodies, which accelerate flood risks. In contrast, the central part of the study area is characterised by low and very low flood risks. The moderate flood risk zones were predominantly found in the eastern part, with localised high-risk areas in the north associated with micro-topographic depressions. These findings underscore the need for integrated flood risk management strategies tailored to the specific vulnerabilities of each zone. Structural measures might reduce the impact on prioritized high-risk areas, while sustainable land management practices can enhance resilience in moderate-risk zones. Additionally, aligning these efforts with global frameworks can ensure that local flood risk management contributes to broader climate adaptation and disaster resilience goals. If spatial flood risk data are integrated into land-use planning and community preparedness programs, they can serve as a valuable basis for evidence-based decision-making and sustainable development in flood-prone regions, fostering climate resilience and reducing vulnerability to future flooding events.

Ali, S., Cheema, M. J. M., Waqas, M. M., Waseem, M., Leta, M. K., Qamar, M. U., Awan, U. K., Bilal, M., & Ur Rahman, M. H. (2021). Flood mitigation in the transboundary chenab river basin: A basin-wise approach from flood forecasting to management. Remote Sensing, 13(19). https://doi.org/10.3390/rs13193916
Animashaun, Yanda Murtala, Bright Amos Samuel, Olaide Sheriffdeen Akande, Ibrahim Abayomi Kuti, Ajayi Johnson Oloruntade, and Akinwale Tope Ogunrinde. "Flood Susceptibility Mapping Using Geographic Information System and Analytical Hierarchy Process: A Case Study of Niger South District, Nigeria." https://www.abrhidro.org.br/iebheBarrocu, G., & Eslamian, S. (2022). Geomorphology and Flooding. In Flood Handbook. https://doi.org/10.1201/9781003262640-3
Clifton, C. F., Day, K. T., Luce, C. H., Grant, G. E., Safeeq, M., Halofsky, J. E., & Staab, B. P. (2018). Effects of climate change on hydrology and water resources in the Blue Mountains, Oregon, USA. Climate Services, 10. https://doi.org/10.1016/j.cliser.2018.03.001
DIVA-GIS. "Data." DIVA-GIS. Accessed 20 January, 2025. https://diva-gis.org/data.html.
Douglas, I. (2017). Flooding in African cities, scales of causes, teleconnections, risks, vulnerability and impacts. International Journal of Disaster Risk Reduction, 26. https://doi.org/10.1016/j.ijdrr.2017.09.024
Du, S., Shi, P., Van Rompaey, A., & Wen, J. (2015). Quantifying the impact of impervious surface location on flood peak discharge in urban areas. Natural Hazards, 76(3). https://doi.org/10.1007/s11069-014-1463-2
Dung, N. B., Long, N. Q., Goyal, R., An, D. T., & Minh, D. T. (2022). The Role of Factors Affecting Flood Hazard Zoning Using Analytical Hierarchy Process: A Review. In Earth Systems and Environment (Vol. 6, Issue 3). https://doi.org/10.1007/s41748-021-00235-4
Esri. "Sentinel-2 Land Cover Explorer." Living Atlas. Accessed 20 January, 2025. https://livingatlas.arcgis.com/landcoverexplorer.
Goepel, K. D. (2013). Implementing AHP as a standard method for MCDM in corporate enterprises. In Proceedings of the International Symposium on the Analytic Hierarchy Process. Kuala Lumpur.Kanito, D., Bedadi, B., & Feyissa, S. (2023). Sediment yield estimation in GIS environment using RUSLE and SDR model in Southern Ethiopia. Geomatics, Natural Hazards and Risk, 14(1). https://doi.org/10.1080/19475705.2023.2167614
Mishra, K., & Sinha, R. (2020). Flood risk assessment in the Kosi megafan using multi-criteria decision analysis: A hydro-geomorphic approach. Geomorphology, 350. https://doi.org/10.1016/j.geomorph.2019.106861
National Aeronautics and Space Administration. "Prediction of Worldwide Energy Resources (POWER) Project." NASA Langley Research Center. Accessed 20 January, 2025. https://power.larc.nasa.gov/.
Ojwang, L., Rosendo, S., Celliers, L., Obura, D., Muiti, A., Kamula, J., & Mwangi, M. (2017). Assessment of Coastal Governance for Climate Change Adaptation in Kenya. Earth’s Future, 5(11). https://doi.org/10.1002/2017EF000595
Rahman, Z. U., Ullah, W., Bai, S., Ullah, S., Jan, M. A., Khan, M., & Tayyab, M. (2023). GIS-based flood susceptibility mapping using bivariate statistical model in Swat River Basin, Eastern Hindukush region, Pakistan. Frontiers in Environmental Science, 11. https://doi.org/10.3389/fenvs.2023.1178540
Saaty, T. (1980). The analytic hierarchy process: planning, priority setting, resource allocation. McGraw-Hill International Book Co, New York.
Saaty, T. L. (1977). A scaling method for priorities in hierarchical structures. Journal of Mathematical Psychology, 15(3). https://doi.org/10.1016/0022-2496(77)90033-5
Saaty, T., & Vargas, L. (2012). Models, methods, concepts & applications of the analytic hierarchy process. In … -Driven Demand and Operations Management Models. https://doi.org/10.1007/978-1-4614-3597-6
Safaei-Moghadam, A., Tarboton, D., & Minsker, B. (2023). Estimating the likelihood of roadway pluvial flood based on crowdsourced traffic data and depression-based DEM analysis. Natural Hazards and Earth System Sciences, 23(1). https://doi.org/10.5194/nhess-23-1-2023
U.S. Geological Survey. "EarthExplorer." Accessed 20 January, 2025. https://earthexplorer.usgs.gov/.
Wang, X., & Xie, H. (2018). A review on applications of remote sensing and geographic information systems (GIS) in water resources and flood risk management. In Water (Switzerland) (Vol. 10, Issue 5). https://doi.org/10.3390/w10050608
Xu, C., Rahman, M., Haase, D., Wu, Y., Su, M., & Pauleit, S. (2020). Surface runoff in urban areas: The role of residential cover and urban growth form. Journal of Cleaner Production, 262. https://doi.org/10.1016/j.jclepro.2020.121421
Yisehak, B., & Zenebe, A. (2021). Modeling multivariate standardized drought index based on the drought information from precipitation and runoff: a case study of Hare watershed of Southern Ethiopian Rift Valley Basin. Modeling Earth Systems and Environment, 7(2). https://doi.org/10.1007/s40808-020-00923-6
Zisopoulou, K., & Panagoulia, D. (2021). An in-depth analysis of physical blue and green water scarcity in agriculture in terms of causes and events and perceived amenability to economic interpretation. Water (Switzerland), 13(12). https://doi.org/10.3390/w13121693