


Do you know that about 70% of the Earth’s surface is covered in water, yet it remains unmapped? As NASA oceanographer Dr. Gene Feldman said,
“We have better maps of the surface of Mars and the moon than we do of the bottom of the ocean.”
But can all these vast blue portions of the universe be explored and mapped like the Mars, which is 54.6 million kilometers away from us, but have nearly 90% of its surface mapped? "Well, that's the million-dollar question, isn't it?"
A group of international researchers have started an initiative (the Seabed 2030 project) in 2017 - when only 6% of the world’s ocean bottom had been mapped (Wölfl et al. 2019). This initiative seeks to make a complete, global bathymetric (water depth) map freely available by 2030; and has added about 14.5 million square km of new water depth (bathymetry) data, mainly derived using ship-based traditional acoustic techniques. Through this effort, approximately 20% of the world’s seafloor has been mapped (Seabed 2030 project, 2020).
It is hoped that a detailed global bathymetric map would help to better study the secret world of the ocean floor and to better understand the oceanographic processes affecting our planet. A bathymetric map of global surface water is not complete without a map of the shallow coastal waters (0 – 30 m), because the latter house about one-third of the total human population (Sale et al. 2014;) and play a crucial role in sustaining global biodiversity and mitigating the impact of storms, floods and wave damage for coastal populations.
A comprehensive map of shallow water environments would be essential for many coastal applications, including resource management (e.g., fishery), intelligence operations (e.g., amphibious operations by the military) and humanitarian operations (e.g., identification of port and shipping channel hazards during disaster relief). It is difficult to map shallow coastal waters using ship-based traditional acoustic techniques used in open oceans due to their shallow nature which poses hazard to navigation. Mapping the shallow coastal waters will also go a long way in achieving the United Nations Sustainable Development Goal 14 - Goal 14: Life Below Water (i.e., “conserve and sustainably use the oceans, seas and marine resources for sustainable development”) (United Nations, 2015).
Minding the gap in data acquisition
The difficulty in deploying ships in shallow coastal waters means that data can only be obtained for very limited areas. Moreover, for applications that require maps with high spatial detail (e.g., amphibious operations, resource management and coastal engineering), it is always difficult to achieve a satisfactory mapping accuracy based on a small number of sampled points during a ship campaign.
Recently, airborne light detection and ranging (LiDAR) Bathymetry (ALB) systems have been introduced. With these techniques, vertical accuracy of about 15 cm in shallow water is possible (although this depends on turbidity and the LiDAR system). While precise bathymetry mapping of water depth to about 20 - 70 m depth can be achieved (Su et al., 2008), costs associated with these systems are relatively high, thus limiting its application in coastal waters where low-cost maps may be needed. Although, data from space-borne hyperspectral sensors such as the Hyperspectral Imager for the Coastal Ocean (HICO) can be used for bathymetry monitoring, they are currently not available for most areas as data must be acquired with aircraft, thereby making systematic regional mapping and monitoring difficult and expensive.
Similarly, hyperspectral data will become more abundant in the future, they are currently not available for most areas as data must be acquired with aircraft, thereby making it an expensive option, especially for systematic regional mapping and monitoring.
Filling the gap in space technology
The use of space technology represents one feasible approach for collecting data necessary to derive bathymetric information, especially in shallow coastal waters where bathymetric mapping with ship-based systems is time-consuming and hazardous. Satellite data acquired using space technology can provide global and frequently updated data coverage that allows derivation of up-to-date information on coastal water environments. Information obtained from the satellite data record (1972-present) allows retrospective studies that can improve our understanding of their long-term and large-scale dynamics. For example, Landsat 8 imagery covers many areas outside the poles every 16 days and can provide free and publicly available satellite data of the water surface. At present, coarse-resolution imagery such as Moderate Resolution Imaging Spectroradiometer (MODIS), Visible Infrared Imaging Radiometer Suite (VIIRS) and Ocean and Land Colour Instrument (OLCI) build on the heritage data from the Sea‐Viewing Wide Field‐of‐View Sensor (SeaWiFS) and MEdium Resolution Imaging Spectrometer (MERIS) to enable the production of long-term observations of water surfaces, with near-daily global imagery . These sensors are suitable for observations of oceans and large lakes, but their coarse spatial resolution (750 m for VIIRS, 1 000 m for MODIS, 300 m for OLCI) prevent their use over smaller water bodies. However, imagers such as Landsat-8 and Sentinel-2 with higher spatial resolution enable mapping of smaller water bodies.
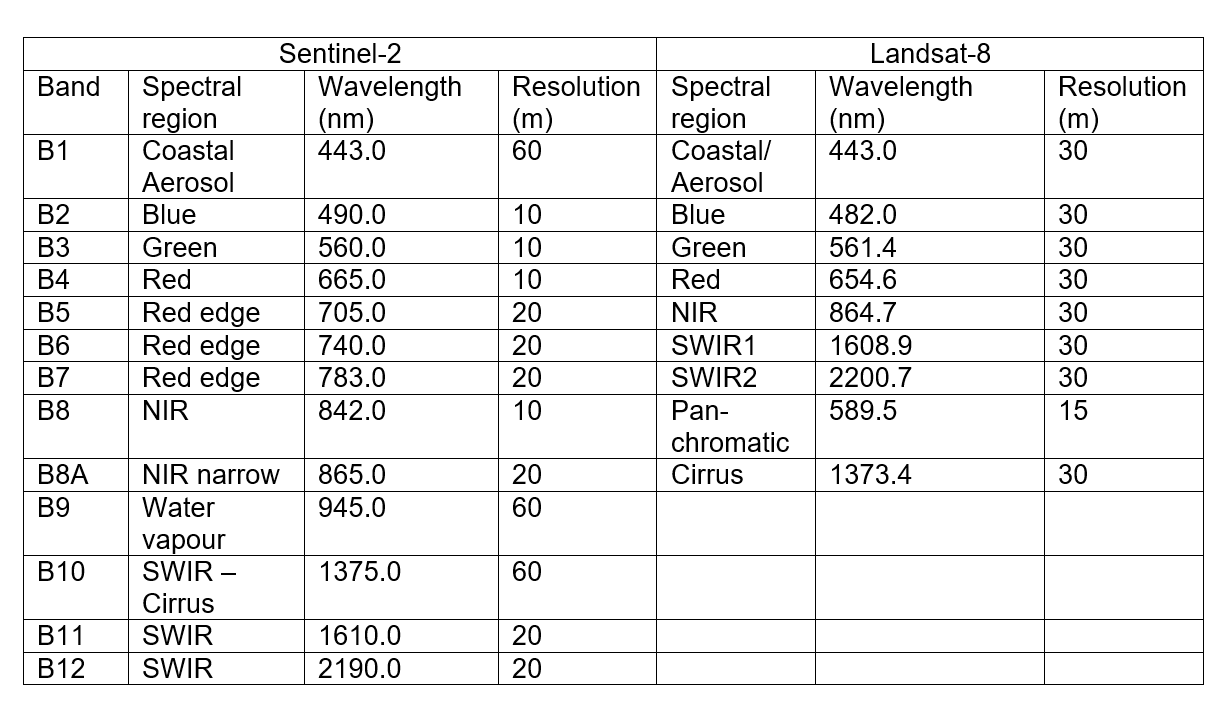
Combined with its predecessors (Landsat 1-7), Landsat 8 provides a near-global and continuous record of the satellite imagery for the world’s land and coastal areas from 1972 to the present day. Compared to Landsat 1-7, Landsat’s 8 new coastal band , together with enhanced spectral coverage and radiometric resolution, now provides us with improved observation of shallow water bodies from space, making it a suitable water imager for shallow coastal waters. Its improved radiometric resolution can produce estimates of spectral reflectance, the quantity needed to estimate water depth. While Landsat 8 was not launched until 2013, its predecessors on Landsat 4, 5 and 7 combine to provide a dense time series of imagery with comparable spatial and spectral resolution typically comprising ~1 500 images over the period 1984-present. Sentinel-2 is a satellite mission that carries a super-spectral sensor with 13 bands in the Visible and Near InfraRed (VNIR) and Shortwave InfraRed (SWIR) wavelength regions – an improvement compared to Landsat images. It is the first satellite mission that observes the word’s coastal areas at both high spatial (10 m, 20 m and 60 m) and temporal (5 days) resolution. The Blue, Green, Red and NIR bands which have 10 m spatial resolution provide a good platform for water quality mapping. Table 1 shows the spatial resolution and spectral band range of both Sentinel-2 and Landsat-8 sensors.
Minding the gap in methods
Despite the potentials of remote sensing (through using satellite data) in deriving water depth in coastal areas, extracting information from the satellite data record is complicated because light transfer in coastal water is an underdetermined problem with three primary and typically unknown components:
- water depth/bathymetry;
- water column properties (such as chlorophyll-a concentration, total suspended sediment and coloured dissolved organic matter; and
- seafloor reflectance (from which seafloor/benthic maps are inferred).
Empirical methods have been developed for mapping water depth at local scales (Stumpf et al. 2003), but these methods require the use of coincident field observations of depth data to establish a statistical relationship between the colour of a satellite pixel and the water depth it represents. The approach thus relies on good-quality georeferenced point measurements of water depth and cannot be used in areas where such data do not exist. Reliance on coincident field data, which are expensive to collect and not always available, means that application in systematic regional mapping is difficult.
To circumvent the lack of in situ measurements, physics-based models (based on light transfer in water), have been developed (Mobley et al. 2005; Lee et al. 1999). Although physics-based inversion methods were initially developed for airborne hyperspectral sensors, they can be applied to multi- or super-spectral satellite data (such as Landsat 8) with acceptable results. Unlike the empirical methods, physics-based methods do not rely on coincident depth data to establish statistical relationship but use all the relevant spectral information available in an image to estimate water depths. These methods rely on numerical simulations of what an area with a given set of environmental characteristics should look like in the image and simulate the spectral reflectance above the water surface with a given set of inputs that include the three unknown parameters (i.e., water depth, water column properties, and seafloor reflectance) (Hamylton et al. 2015).
Filling the gaps in methods
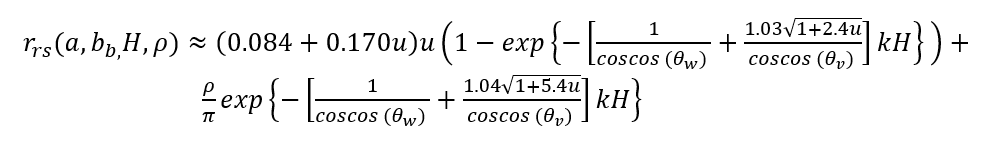
As hinted above, physics-based methods are the only option to produce bathymetry for areas with no data for calibration. In addition to bathymetry, seafloor reflectance and water optical properties can be retrieved. Seafloor features such as coral reef, algae and seagrass can then be inferred from the measured seafloor reflectance while chlorophyll-a, total suspended sediments, coloured dissolved organic matter can be estimated from water column optical properties. Physics-based methods estimate bathymetry using a radiative transfer model (RTM) approach (Equations 1 – 7 ). This model relates the sub-surface remote sensing reflectance, rrs, to absorption (a) and backscattering coefficients (b_b) of the water column, the bottom reflectance (ρ) and water depth (H).

where rrs, which is a function of a, bb, H, ρ, of is calculated using equation 2:


where  and
and  are the sub-surface solar zenith and sub-surface sensor viewing angles, respectively. As defined by Lee et al. (1999), absorption (a) and backscattering coefficients (
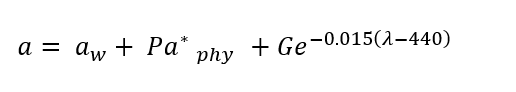
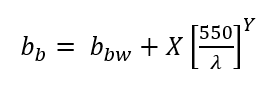
 ) are functions of 1) the absorption coefficient of phytoplankton at 440 nm, P; 2) the absorption coefficient of coloured dissolved materials at 440 nm, G; and 3) the backscattering coefficient of suspended particles at 550 nm, X. These are expressed as:
where and
and  are the absorption and backscattering coefficients of pure water respectively,
  is the specific absorption of coefficient of phytoplankton (normalized to a value of 1.0 at 440 nm), λ is the centre wavelength and Y is the spectral shape parameter.
The bottom reflectance ρ is expressed as:

where ρsand is the irradiance reflectance spectrum of sand normalized at 550 nm and B is the bottom albedo value at 550 nm.

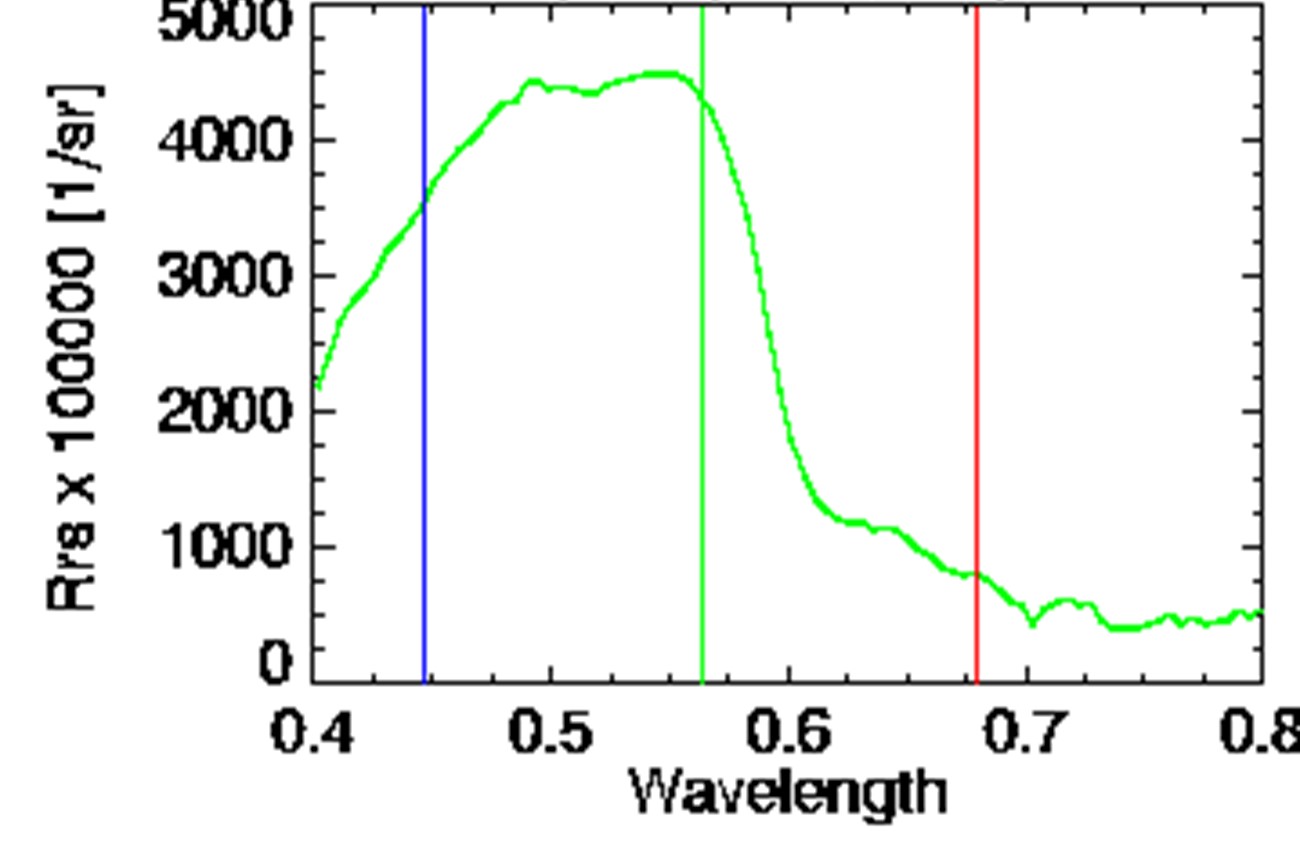
To implement physics-based modelling, a look-up table (e.g., Figure 1 ) can be constructed using numerical simulation of what an area with a given set of environmental characteristics should look like in a multiband remote sensing image (e.g., a four-band image shown in Figure 1). The characteristics that influence each pixel in an image include water depth (Z in Figure 1), water quality (absorption and scattering coefficients, represented as P, B, G in Figure 1), seafloor reflectance (sand and algae in Figure 1). With many (typically thousands) simulations of what different combinations of the remaining characteristics should look like in the image, the model can then be inverted by assigning to each pixel (Figure 2) in an image those parameter values that provide the closet match between the simulated and observed spectra (Figure 3).

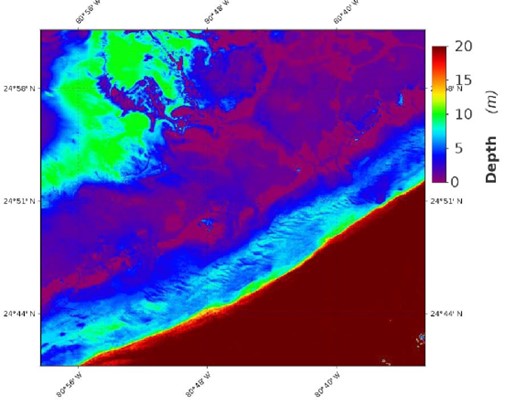
With physics-based inversion methods, it is now possible to develop methodologies necessary to produce regularly updated bathymetric map (for example, Fig 4) from nearshore areas (a previously inconceivable task), thus reducing the risk of ship groundings around the coasts, for example.
New opportunities can help us fill the mapping gaps
Physics-based satellite-derived bathymetry (SDB) will not replace high-resolution charts from acoustic techniques but it will provide a transition in mapping from a local scale and field-intensive research to operational use of freely available satellite data. It will assist various governments in identifying stable and dynamic seafloor areas along their coasts, especially in areas where frequent change in morphology poses a great challenge to cartographers. It will equally help national hydrographic services of countries in accessing the bathymetry of areas where access is denied. This is of great interest to many national hydrographic services including Canada, which has the largest coastline in the world and where large parts of the Arctic are only covered by old nautical charts. Furthermore, maritime transportation in the Arctic is central to indigenous people’s social and economic activities but remains poorly surveyed. SDB can offer great promise to fill gaps in existing survey data coverage, thus revolutionizing the way water depth is derived. Additionally, bathymetric estimates from satellite data can assist cities in flood management and planning. In Canada, for example, large companies are partnering with the municipals of major cities to design flood mitigation plans using historical depths and elevation maps to formulate policies in response to flood safety concerns, due to future sea-level rise and climate change.
Hamylton, Sarah, John Hedley, and Robin Beaman. 2015. “Derivation of High-Resolution Bathymetry from Multispectral Satellite Imagery: A Comparison of Empirical and Optimisation Methods through Geographical Error Analysis.” Remote Sensing 7 (12): 16257–73. https://doi.org/10.3390/rs71215829.
Lee, Zhongping, Kendall L. Carder, Curtis D. Mobley, Robert G. Steward, and Jennifer S. Patch. 1999. “Hyperspectral Remote Sensing for Shallow Waters: 2 Deriving Bottom Depths and Water Properties by Optimization.” Applied Optics 38 (18): 3831. https://doi.org/10.1364/ao.38.003831.
Mobley, Curtis D., Lydia K. Sundman, Curtiss O. Davis, Jeffrey H. Bowles, Trijntje Valerie Downes, Robert A. Leathers, Marcos J. Montes, et al. 2005. “Interpretation of Hyperspectral Remote-Sensing Imagery by Spectrum Matching and Look-up Tables.” Applied Optics 44 (17): 3576. https://doi.org/10.1364/ao.44.003576.
Sale, Peter F., Tundi Agardy, Cameron H. Ainsworth, Blake E. Feist, Johann D. Bell, Patrick Christie, Ove Hoegh-Guldberg, et al. 2014. “Transforming Management of Tropical Coastal Seas to Cope with Challenges of the 21st Century.” Marine Pollution Bulletin 85 (1): 8–23. https://doi.org/10.1016/j.marpolbul.2014.06.005.
Seabed 2030 Project. Nearly a Fifth of the World’s Ocean Floor Now Mapped. Press Release, 2020. https://seabed2030.gebco.net/news/gebco_2020_release.html.
Stumpf, Richard P., Kristine Holderied, and Mark Sinclair. 2003. Determination of Water Depth with High-Resolution Satellite Imagery over Variable Bottom Types. Limnology and Oceanography 48 (1part2): 547–56. https://doi.org/10.4319/lo.2003.48.1_part_2.0547.
Su, Haibin, Hongxing Liu, and William D. Heyman. 2008. Automated Derivation of Bathymetric Information from Multi-Spectral Satellite Imagery Using a Non-Linear Inversion Model. Marine Geodesy 31 (4): 281–98. https://doi.org/10.1080/01490410802466652.
United Nations. Transforming Our World: the 2030 Agenda for Sustainable Development. 2015. https://sustainabledevelopment.un.org/post2015/transformingourworld/pub….
Westley, K. 2018. Application of Enhanced Satellite Remote Sensing Techniques to Broad-Scale Maritime Cultural Heritage Research and Management in the Eastern Mediterranean. Honor Frost Foundation.” n.d. Accessed July 5, 2022. https://honorfrostfoundation.org/2018/08/15/application-of-enhanced-sat…
Wölfl, Anne-Cathrin, Helen Snaith, Sam Amirebrahimi, Colin W. Devey, Boris Dorschel, Vicki Ferrini, Veerle A. I. Huvenne, et al. 2019. “Seafloor Mapping – the Challenge of a Truly Global Ocean Bathymetry.” Frontiers in Marine Science 6 (June). https://doi.org/10.3389/fmars.2019.00283.

